All Weather vs S&P 500 vs Age-Based: How 3 Portfolio Strategies Performed Through COVID, Tariffs, and War
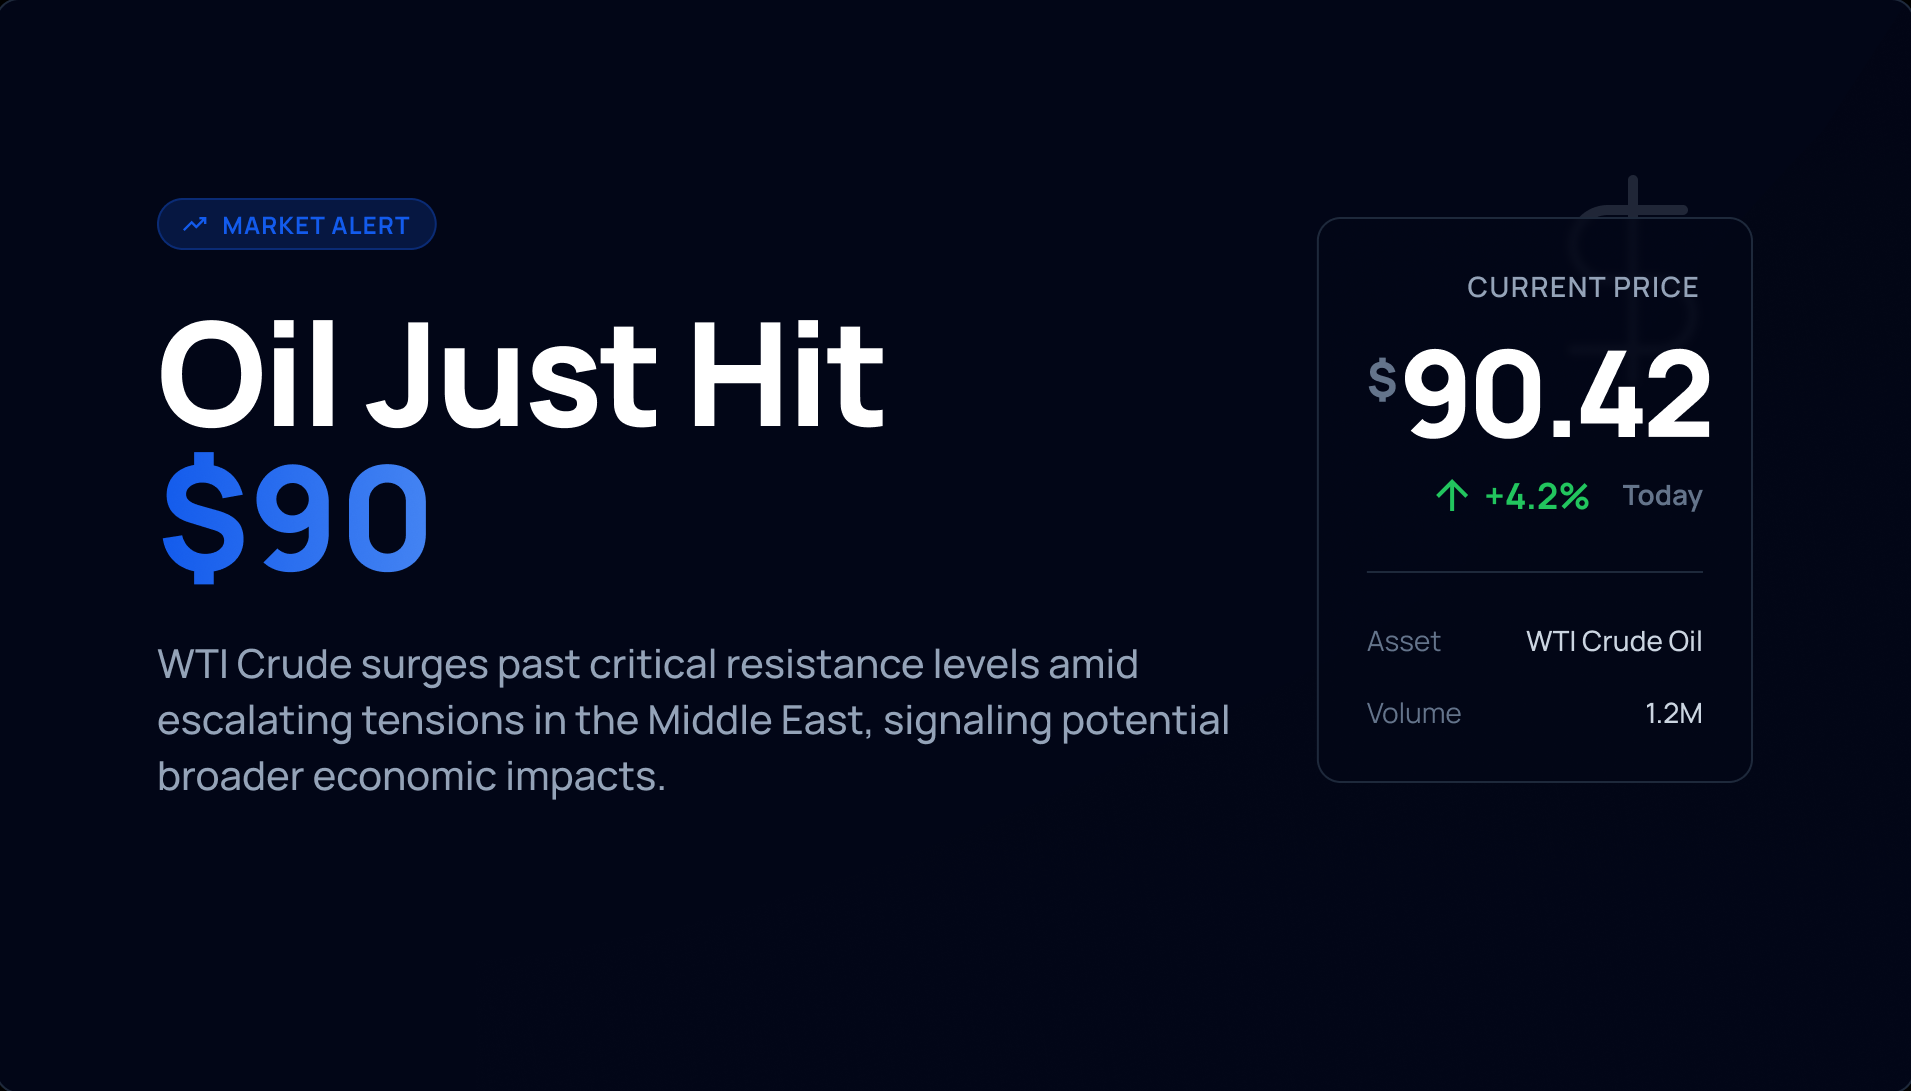
Oil just crossed $100 a barrel. Gold broke $5,000. The S&P 500 fell below its 200-day moving average for the first time in 2026, and the VIX is sitting at 27 — deep in fear territory.
This is the third major market shock in six years. First, a pandemic crashed stocks 34% in 33 days. Then, escalating tariffs dragged the market down 20% through early 2025. Now, the Iran war and an oil shock are testing portfolios again — this time with inflation as the accelerant.
Each crisis was different. A health emergency. A trade war. A shooting war. And each one asked the same question: does your investment strategy actually work when it matters most?
We have the data to answer that. Since February 2016, we’ve run three simulated portfolios on EasyStocksAI, each investing roughly $1,300 per month for 10 years. Same starting point, same monthly discipline, three radically different philosophies.
S&P 500 Scoring-Driven — 100% equities. Each month, buy the highest-scoring stock according to our 4-pillar scoring system. No bonds, no gold, no safety net.
All Weather — Inspired by Ray Dalio’s framework: 30% stocks, 40% long-term bonds, 15% intermediate bonds, 7.5% gold, 7.5% commodities. Designed to survive any economic environment.
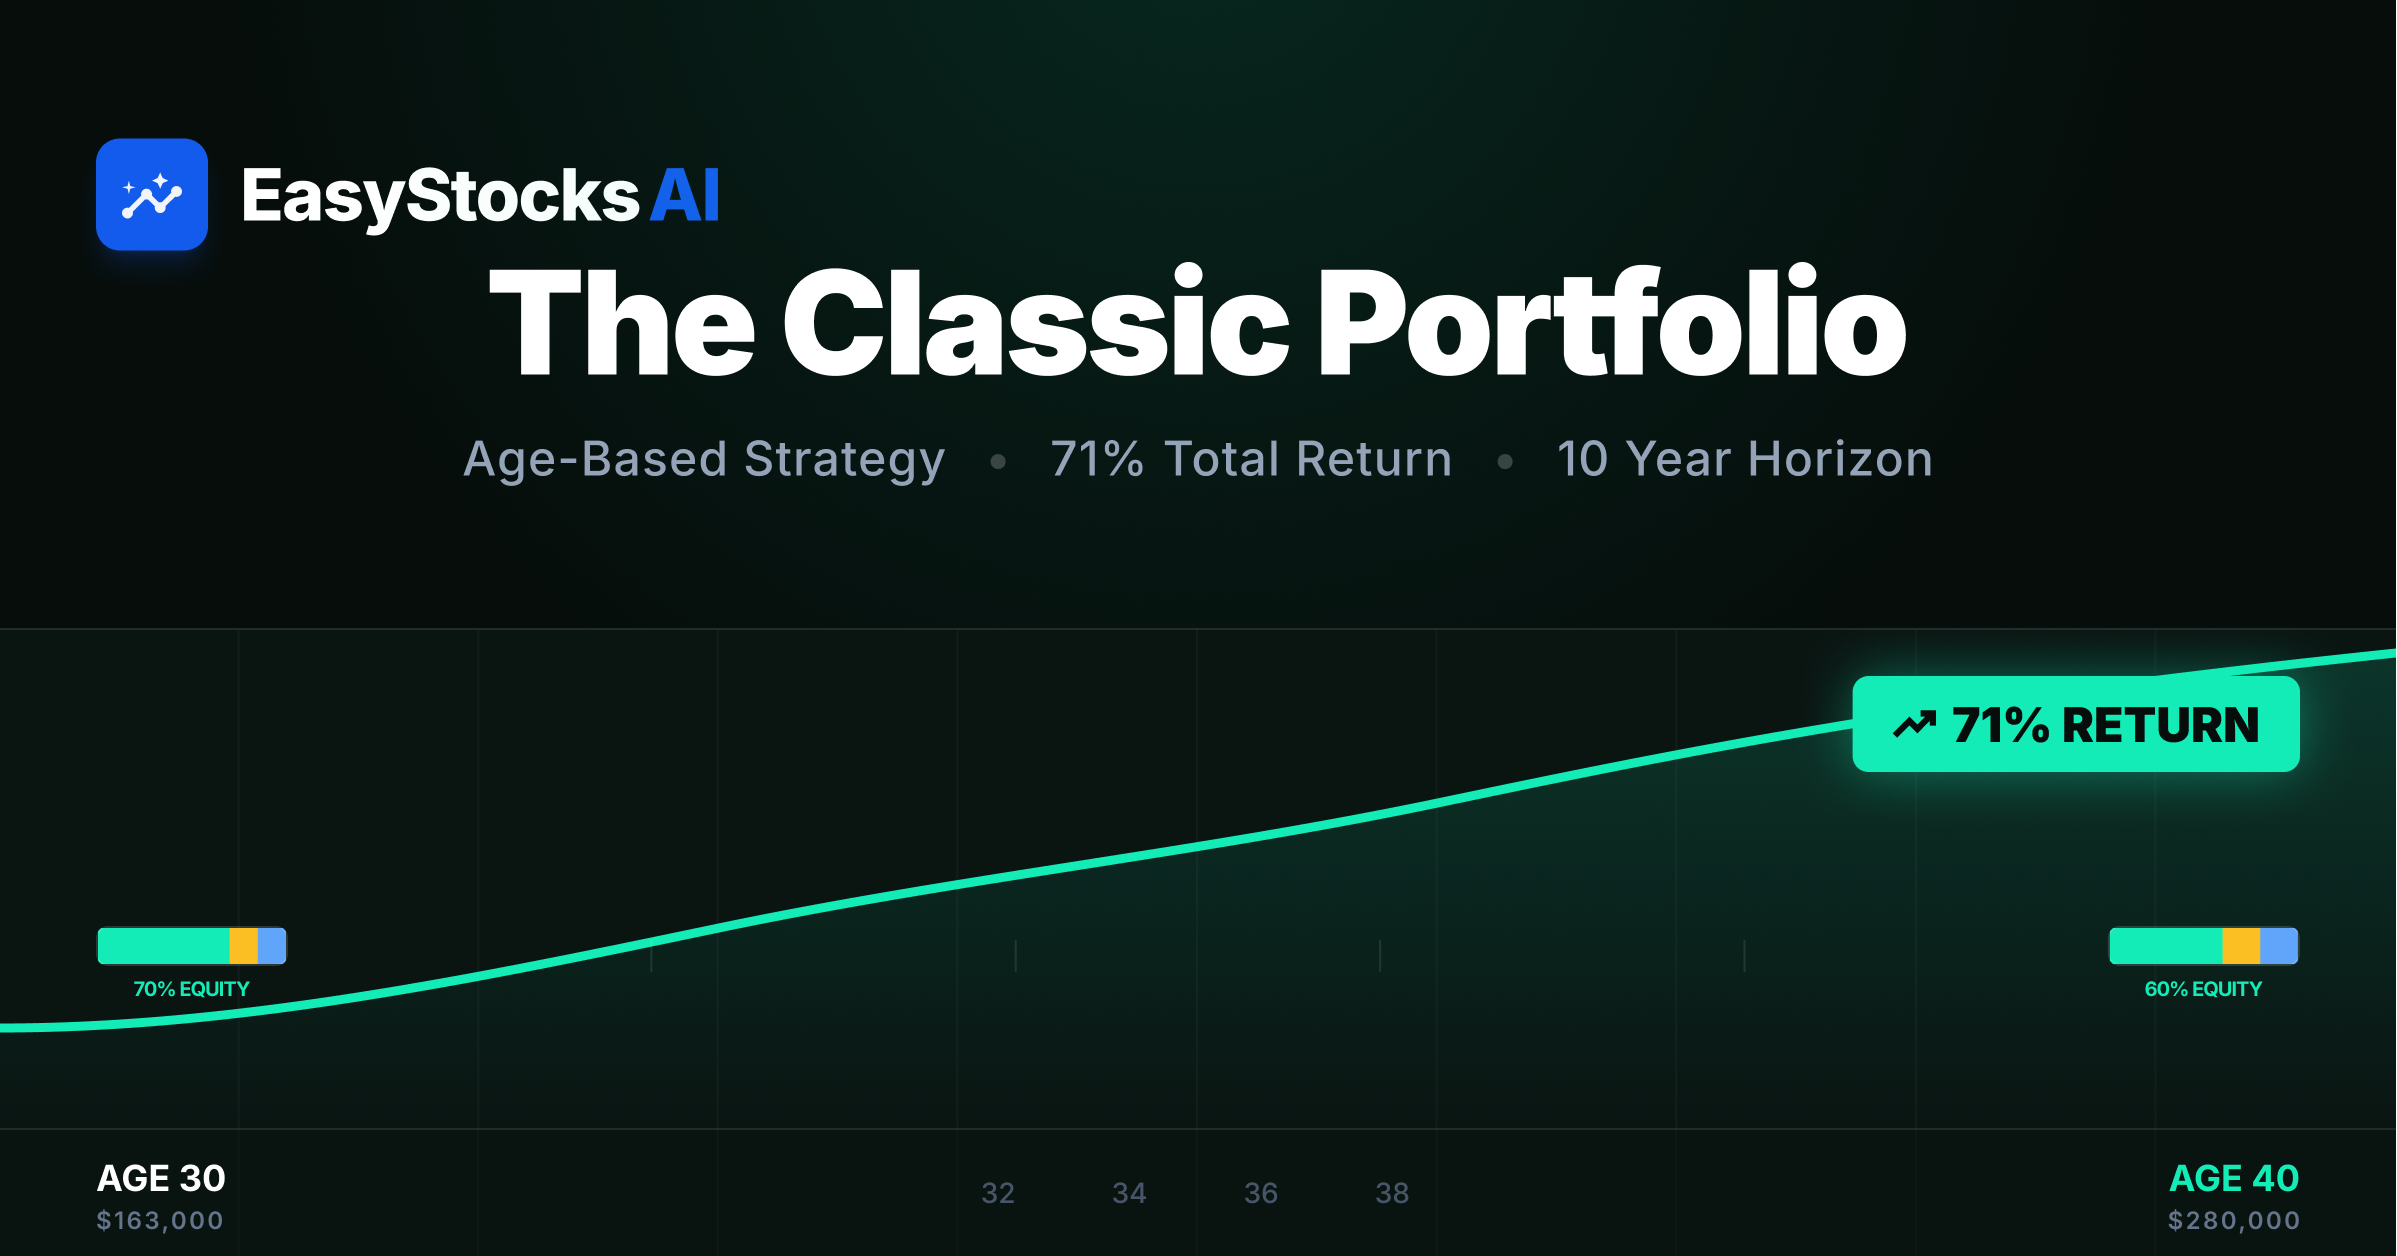
Classic Age-Based — The 100-minus-age approach. For a 40-year-old investor: 60% stocks, 40% defensive assets (bonds, gold, commodities).
Here’s how they stack up after a decade:
| S&P 500 | Classic | All Weather | |
|---|---|---|---|
| Total Invested | $165,468 | $163,583 | $159,735 |
| Current Value | $446,920 | $270,824 | $187,006 |
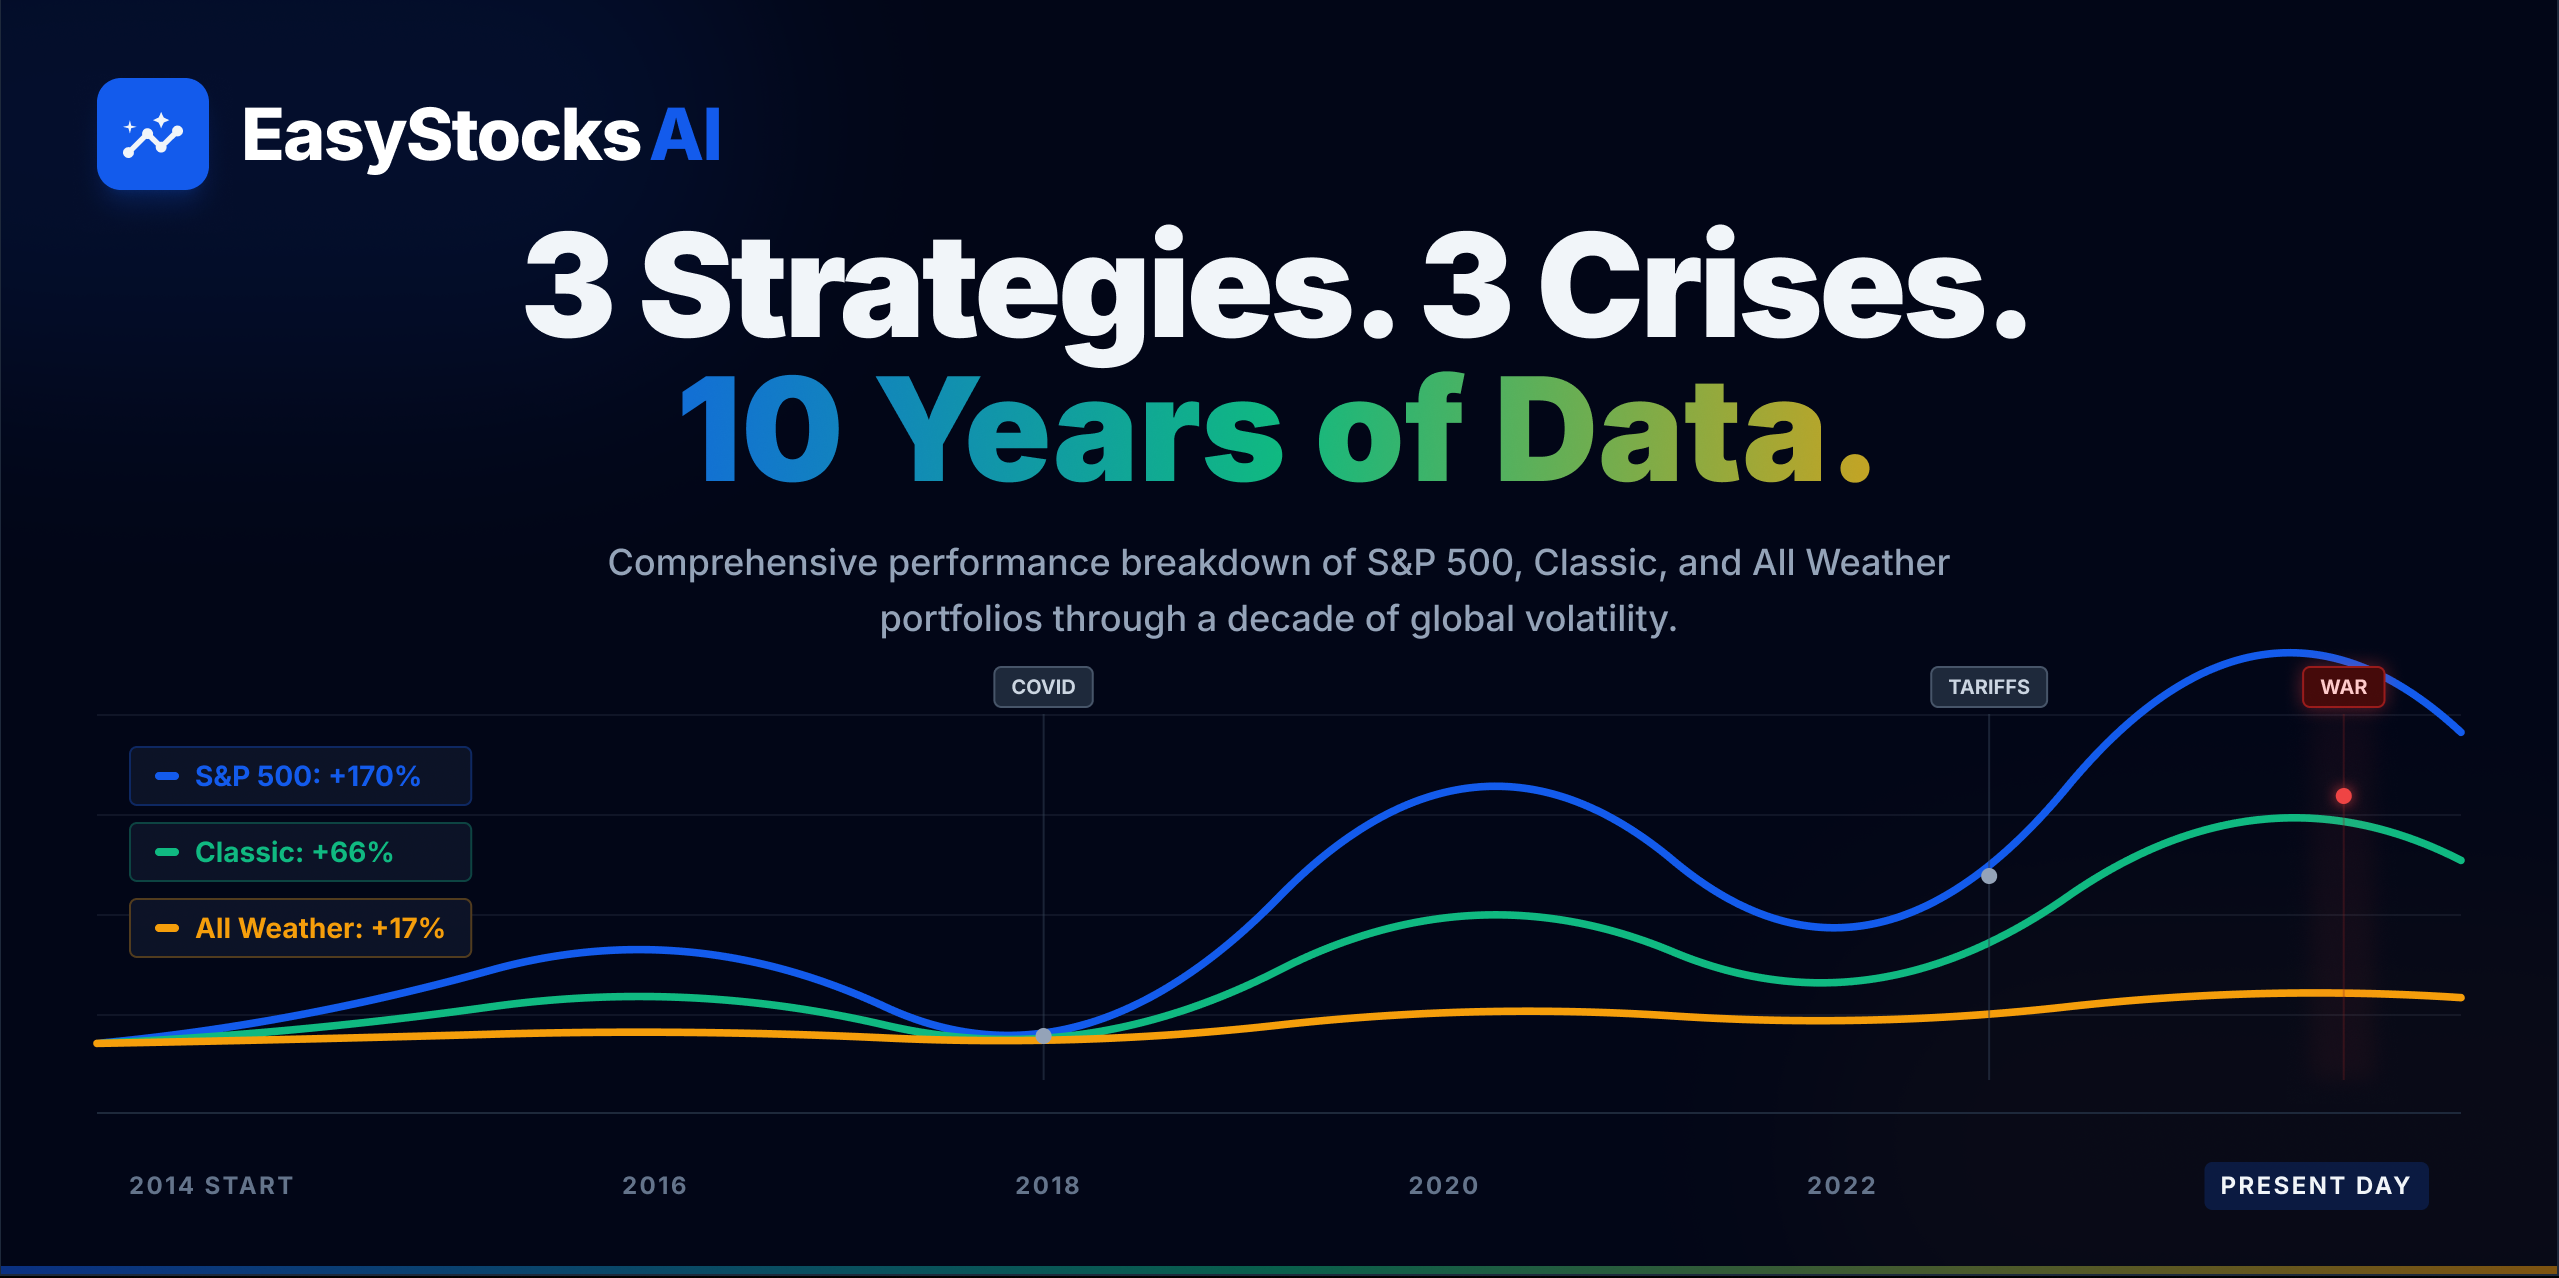
| Total Return | +170% | +66% | +17% |
| Worst Drawdown | -34.9% | -25.6% | -8.7% |
The numbers tell a clear story — but not a simple one. The S&P 500 strategy generated $260,000 more than All Weather. But it also subjected you to three gut-wrenching drawdowns that tested every ounce of discipline you had.
Let’s walk through each crisis.
Crisis #1: COVID-19 Crash (February – March 2020)
The fastest 30% market drop in history. On February 19, 2020, stocks hit an all-time high. By March 23, a third of the market had evaporated. Lockdowns, hospital overwhelm, and a global economy grinding to a halt — all in 33 days.
| Strategy | Pre-Crash Value | Bottom | Drawdown |
|---|---|---|---|
| S&P 500 | $85,741 | $55,825 | -34.9% |
| Classic | $80,185 | $59,689 | -25.6% |
| All Weather | $75,492 | $68,932 | -8.7% |
The All Weather portfolio barely flinched. While the S&P 500 strategy shed nearly $30,000 in paper value, All Weather lost just $6,560. Its 55% bond allocation surged as investors fled to Treasuries, and gold held steady as the ultimate safe haven.
The Classic portfolio, with its 40% defensive allocation, split the difference — a significant drawdown at -25.6%, but far less devastating than pure equities.
Here’s what mattered most: all three strategies kept buying. Monthly contributions continued through the crash, picking up shares at 30-year lows. Dollar-cost averaging doesn’t get the credit it deserves — it’s the discipline of buying during panic that powered the recovery for all three portfolios in the months that followed.
Crisis #2: The Tariff Crash (February – April 2025)
Different animal. No single shock event — instead, a slow grind of escalating trade tensions. Trump’s tariff policy had pushed US manufacturing into contraction for 10 consecutive months. The ISM index kept declining. Markets saw it coming but couldn’t avoid it.
Between February 19 and April 8, 2025, the S&P 500 scoring portfolio dropped from $314,214 to $250,621.
| Strategy | Pre-Crash Value | Bottom | Drawdown |
|---|---|---|---|
| S&P 500 | $314,214 | $250,621 | -20.2% |
| Classic | $216,554 | $189,676 | -12.4% |
| All Weather | $161,283 | $153,095 | -5.1% |
The pattern held. All Weather absorbed the shock better than any other strategy, losing just $8,188 compared to the S&P 500’s $63,593.
Think about that in real terms. The S&P 500 strategy lost nearly two full years of monthly contributions in paper value. All Weather lost about two months’ worth. That’s the difference between a sleepless week and barely noticing.
Gold and long-term Treasuries both performed their intended role during this selloff — rising as equities fell, cushioning the All Weather and Classic portfolios. The tariff crash was a textbook demand shock: uncertainty kills spending, investors flee to safety, bonds and gold rally. Exactly the scenario diversification was built for.
Crisis #3: Iran War and the Oil Shock (February – March 2026)
On February 28, 2026, the United States and Israel launched Operation Epic Fury — surprise airstrikes targeting Iran’s nuclear and missile programs. Oil surged past $100 a barrel within days. Gold broke $5,000. The Strait of Hormuz, carrying roughly 20% of the world’s oil supply, became a conflict zone.
This crisis is still unfolding. But the early data reveals something the previous two crises didn’t.
| Strategy | Peak (Feb 19) | Current (Mar 19) | Drawdown |
|---|---|---|---|
| S&P 500 | $458,538 | $446,920 | -2.5% |
| Classic | $278,863 | $270,824 | -2.9% |
| All Weather | $194,054 | $187,006 | -3.6% |
For the first time in our data, All Weather is not the most resilient strategy.
Why? Because this isn’t a demand shock — it’s an inflation shock. And that changes everything.
When oil hits $100, it doesn’t just hurt stocks. It pushes Treasury yields higher as markets price in stickier inflation. The 10-year yield climbed to 4.41% in March. When yields rise, bond prices fall — and 55% of the All Weather portfolio sits in bonds.
Gold and commodities are surging, yes. Gold is up past $5,000, and energy commodities are spiking. But they make up only 15% of the All Weather portfolio. That’s not enough to offset the damage from the bond side.
Meanwhile, the S&P 500 scoring portfolio is doing something unexpected: holding up relatively well. Why? The Great Rotation. In 2026, energy stocks are up 25% year-to-date. Materials are up 18%. Consumer staples are up 16%. Technology — the Magnificent Seven’s home territory — is down 4%.
The scoring system naturally holds stocks like MPC and VLO — energy companies that scored highly on dividend growth, cash flow, and valuation. With oil at $100, those positions are offsetting losses in other sectors. The system doesn’t predict geopolitical events, but its diversification across sectors means it captures the rotation wherever it happens.
The Classic portfolio, with its 60/40 split, is navigating a middle path — hurt by its bond exposure but cushioned by its broader stock allocation.
This is the scenario that All Weather critics have always warned about: stagflation. When inflation is driven by supply shocks — not by a booming economy — bonds and stocks can fall together. The traditional hedge breaks down.
The Price of Safety
Let’s be honest about the tradeoff.
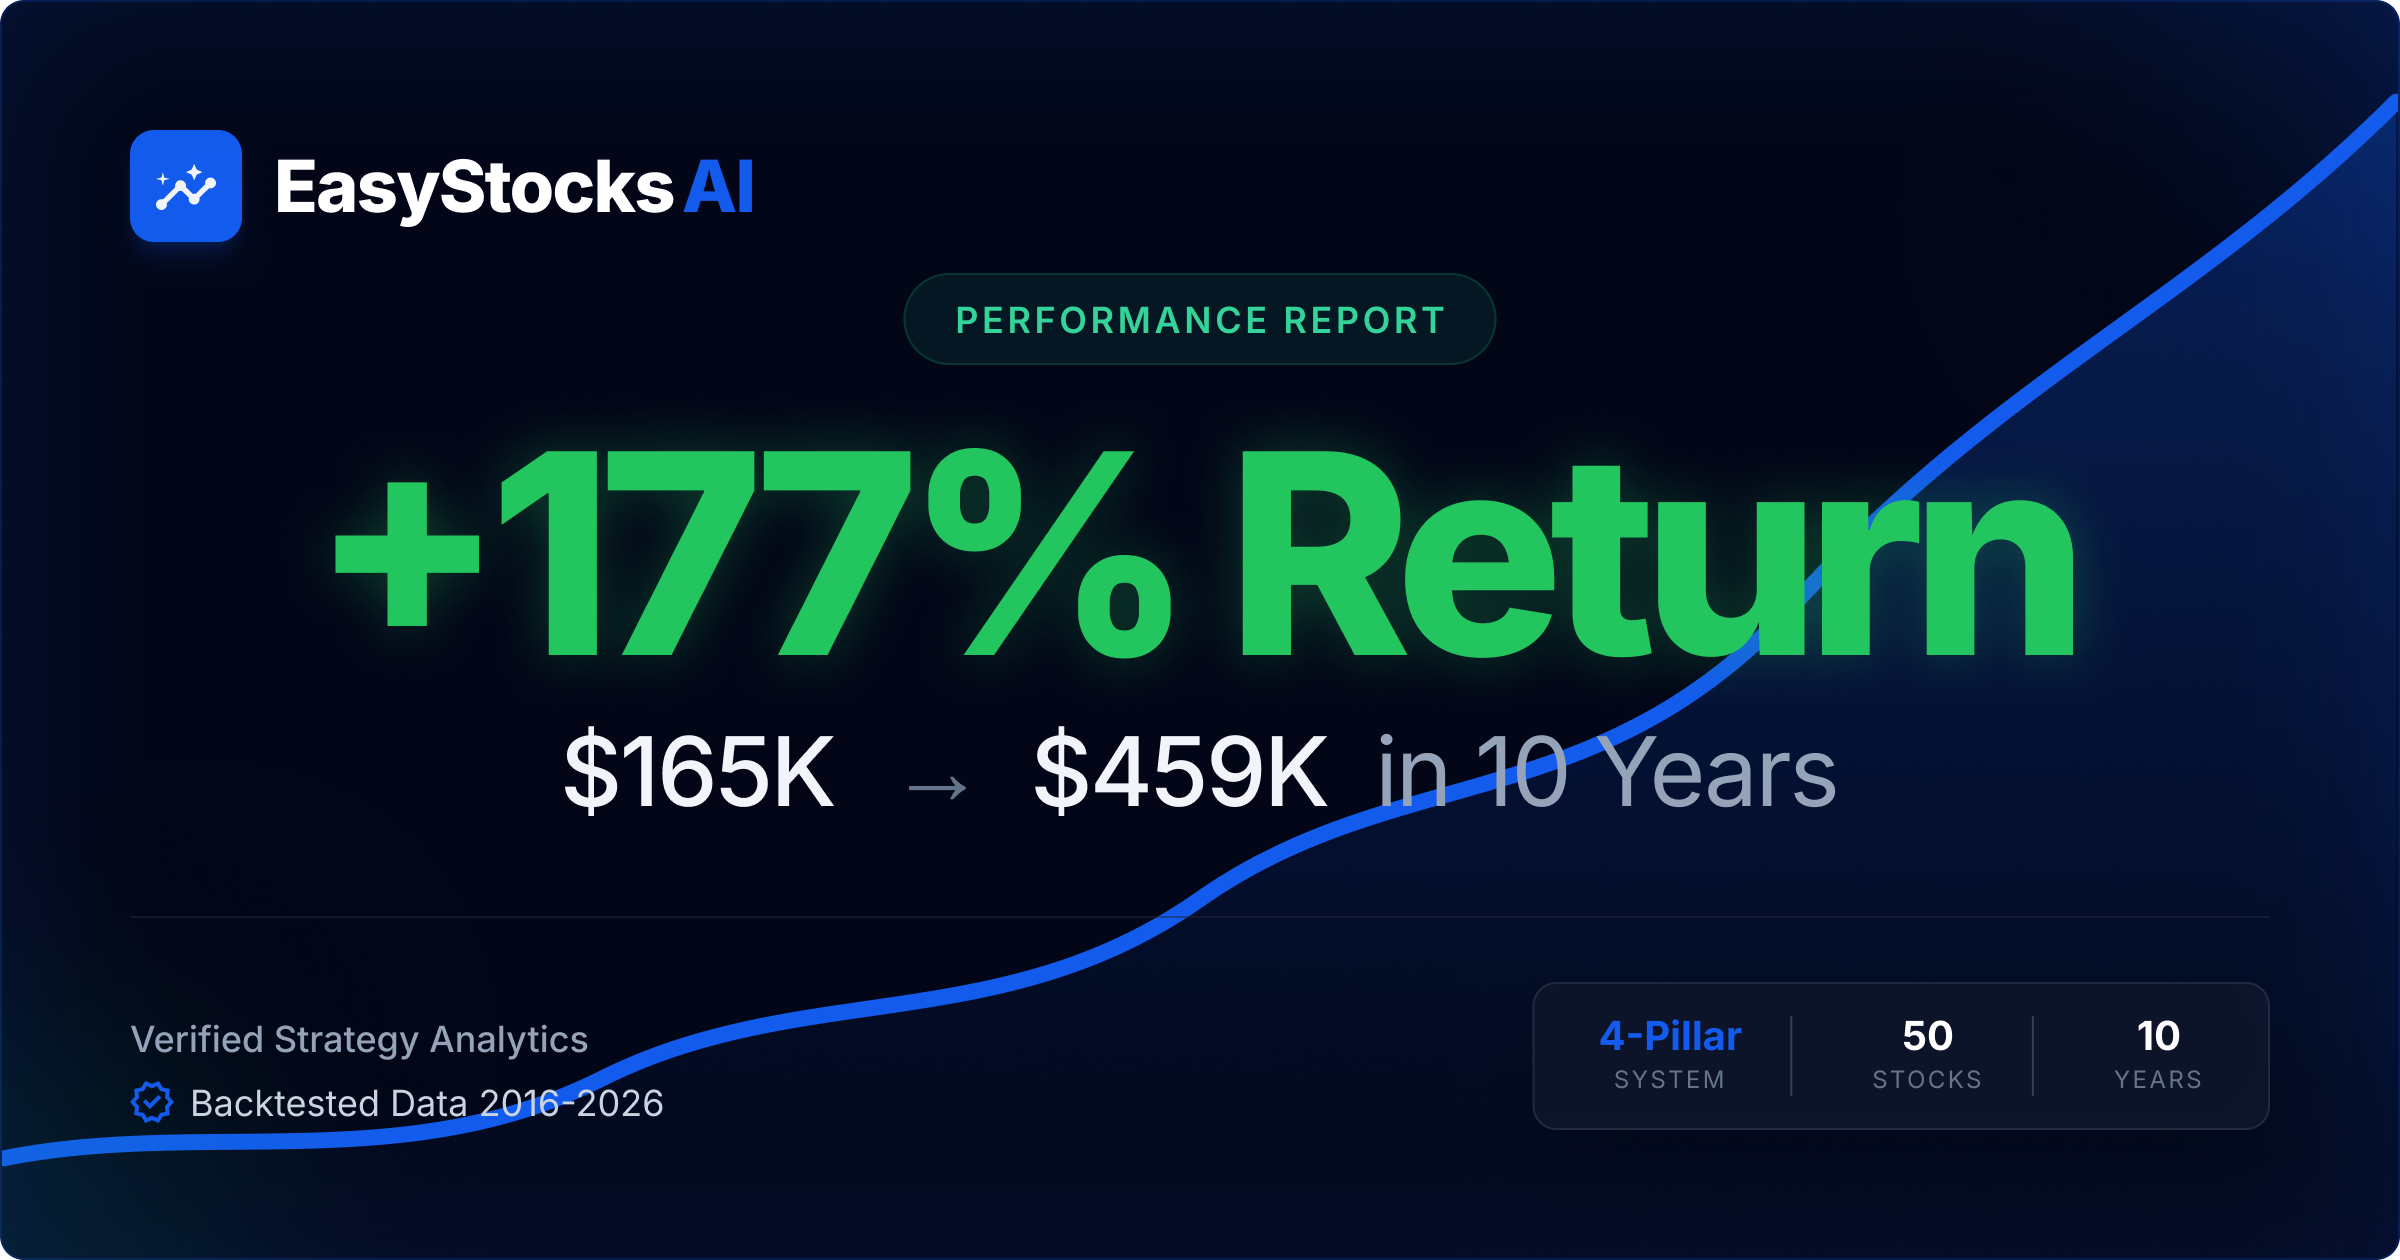
Over 10 years, the S&P 500 scoring strategy turned $165,468 into $446,920. That’s +170% — roughly $281,000 in profit.
The All Weather strategy turned $159,735 into $187,006. That’s +17% — about $27,000 in profit.
The difference: $254,000 in forgone gains. That’s the price tag for never seeing your portfolio drop more than 8.7%.
Is it worth it? That depends entirely on who you are.
Most investors believe they can handle a 35% drawdown. They’ve read the studies, they know the math, they understand that stocks always recover eventually. But believing and experiencing are different things. When you’re staring at $30,000 in paper losses — money that took you two years to save — the urge to sell and stop the bleeding is overwhelming. And if you sell at the bottom, you lock in the worst possible outcome.
The S&P 500 strategy’s 170% return only exists for investors who held through every crash without flinching. Every single month, for 10 years, through a pandemic, a trade war, and a shooting war. That takes a level of discipline most people overestimate in themselves.
All Weather’s real value isn’t the return. It’s that you never face the moment where you’re tempted to destroy your own strategy. You never white-knuckle it through a -35% drawdown. You never panic-sell because the losses feel unbearable. The strategy is psychologically survivable — and surviving is the prerequisite for compounding.
The Classic age-based approach sits squarely in the middle, and that might be exactly the point.
| S&P 500 | Classic | All Weather | |
|---|---|---|---|
| Total Return | +170% | +66% | +17% |
| Worst Drawdown | -34.9% | -25.6% | -8.7% |
| Largest $ Loss | -$63,593 | -$26,878 | -$8,188 |
| Crises Where It Led | 1 of 3 | 0 of 3 | 2 of 3 |
| Sleep Quality | Poor | Moderate | Excellent |
For a 40-year-old investor with 20+ years until retirement, the Classic strategy captured 66% total returns while limiting the worst drawdown to -25.6%. Not the highest return, not the lowest risk — but a realistic balance for someone who wants growth without the full emotional weight of a pure equity portfolio.
What This Data Actually Tells Us
1. No single strategy wins every crisis. All Weather dominated during COVID (demand shock) and the tariff selloff (policy shock). It struggled during the Iran oil shock (inflation shock). The S&P 500 strategy took the worst hits during panics but recovered fastest and benefited from sector rotation. Choosing a strategy based on the last crisis is a recipe for disappointment.
2. The best strategy is the one you’ll actually stick with. A 170% return means nothing if you panic-sell at -35%. A 17% return is real if you held every single month. Know yourself before you pick a strategy.
3. Dollar-cost averaging is the unsung hero. All three strategies kept buying through every crash. Those monthly purchases at depressed prices powered recoveries that lump-sum investors couldn’t replicate. Consistency beats timing.
4. Your age and risk tolerance matter more than backtests. A 25-year-old with 40 years of compounding ahead should make a very different choice than a 55-year-old approaching retirement. The Classic strategy exists because the answer to “which strategy is best?” is always “for whom?”
5. Diversification has a price — and it’s steep. The $254,000 gap between the S&P 500 and All Weather strategies is real. Defensive assets protect during crises, but they drag on returns during the other 90% of the time when markets are climbing. You’re not paying for protection during the crash. You’re paying for it during every quiet month in between.
Explore the Strategies
Each portfolio is live and explorable:
-
S&P 500 Scoring-Driven Portfolio — Every holding, every sector, the full 10-year chart. Read the deep dive.
-
All Weather Portfolio — Bonds, gold, commodities, and stocks in Ray Dalio’s framework. Read the deep dive.
-
Classic Age-Based Portfolio — The 60/40 approach for a 40-year-old investor. Read the deep dive.
For more on how the current Iran crisis is reshaping energy markets, see our analysis: Oil Just Hit $90: What the Iran Crisis Means for Energy Stocks and Commodity ETFs.
The next crisis is always different from the last one. Your strategy shouldn’t depend on guessing which crisis comes next — it should survive all of them.
These are simulated portfolios using historical data. Past performance does not guarantee future results. This is not financial advice — all investment decisions are your own.