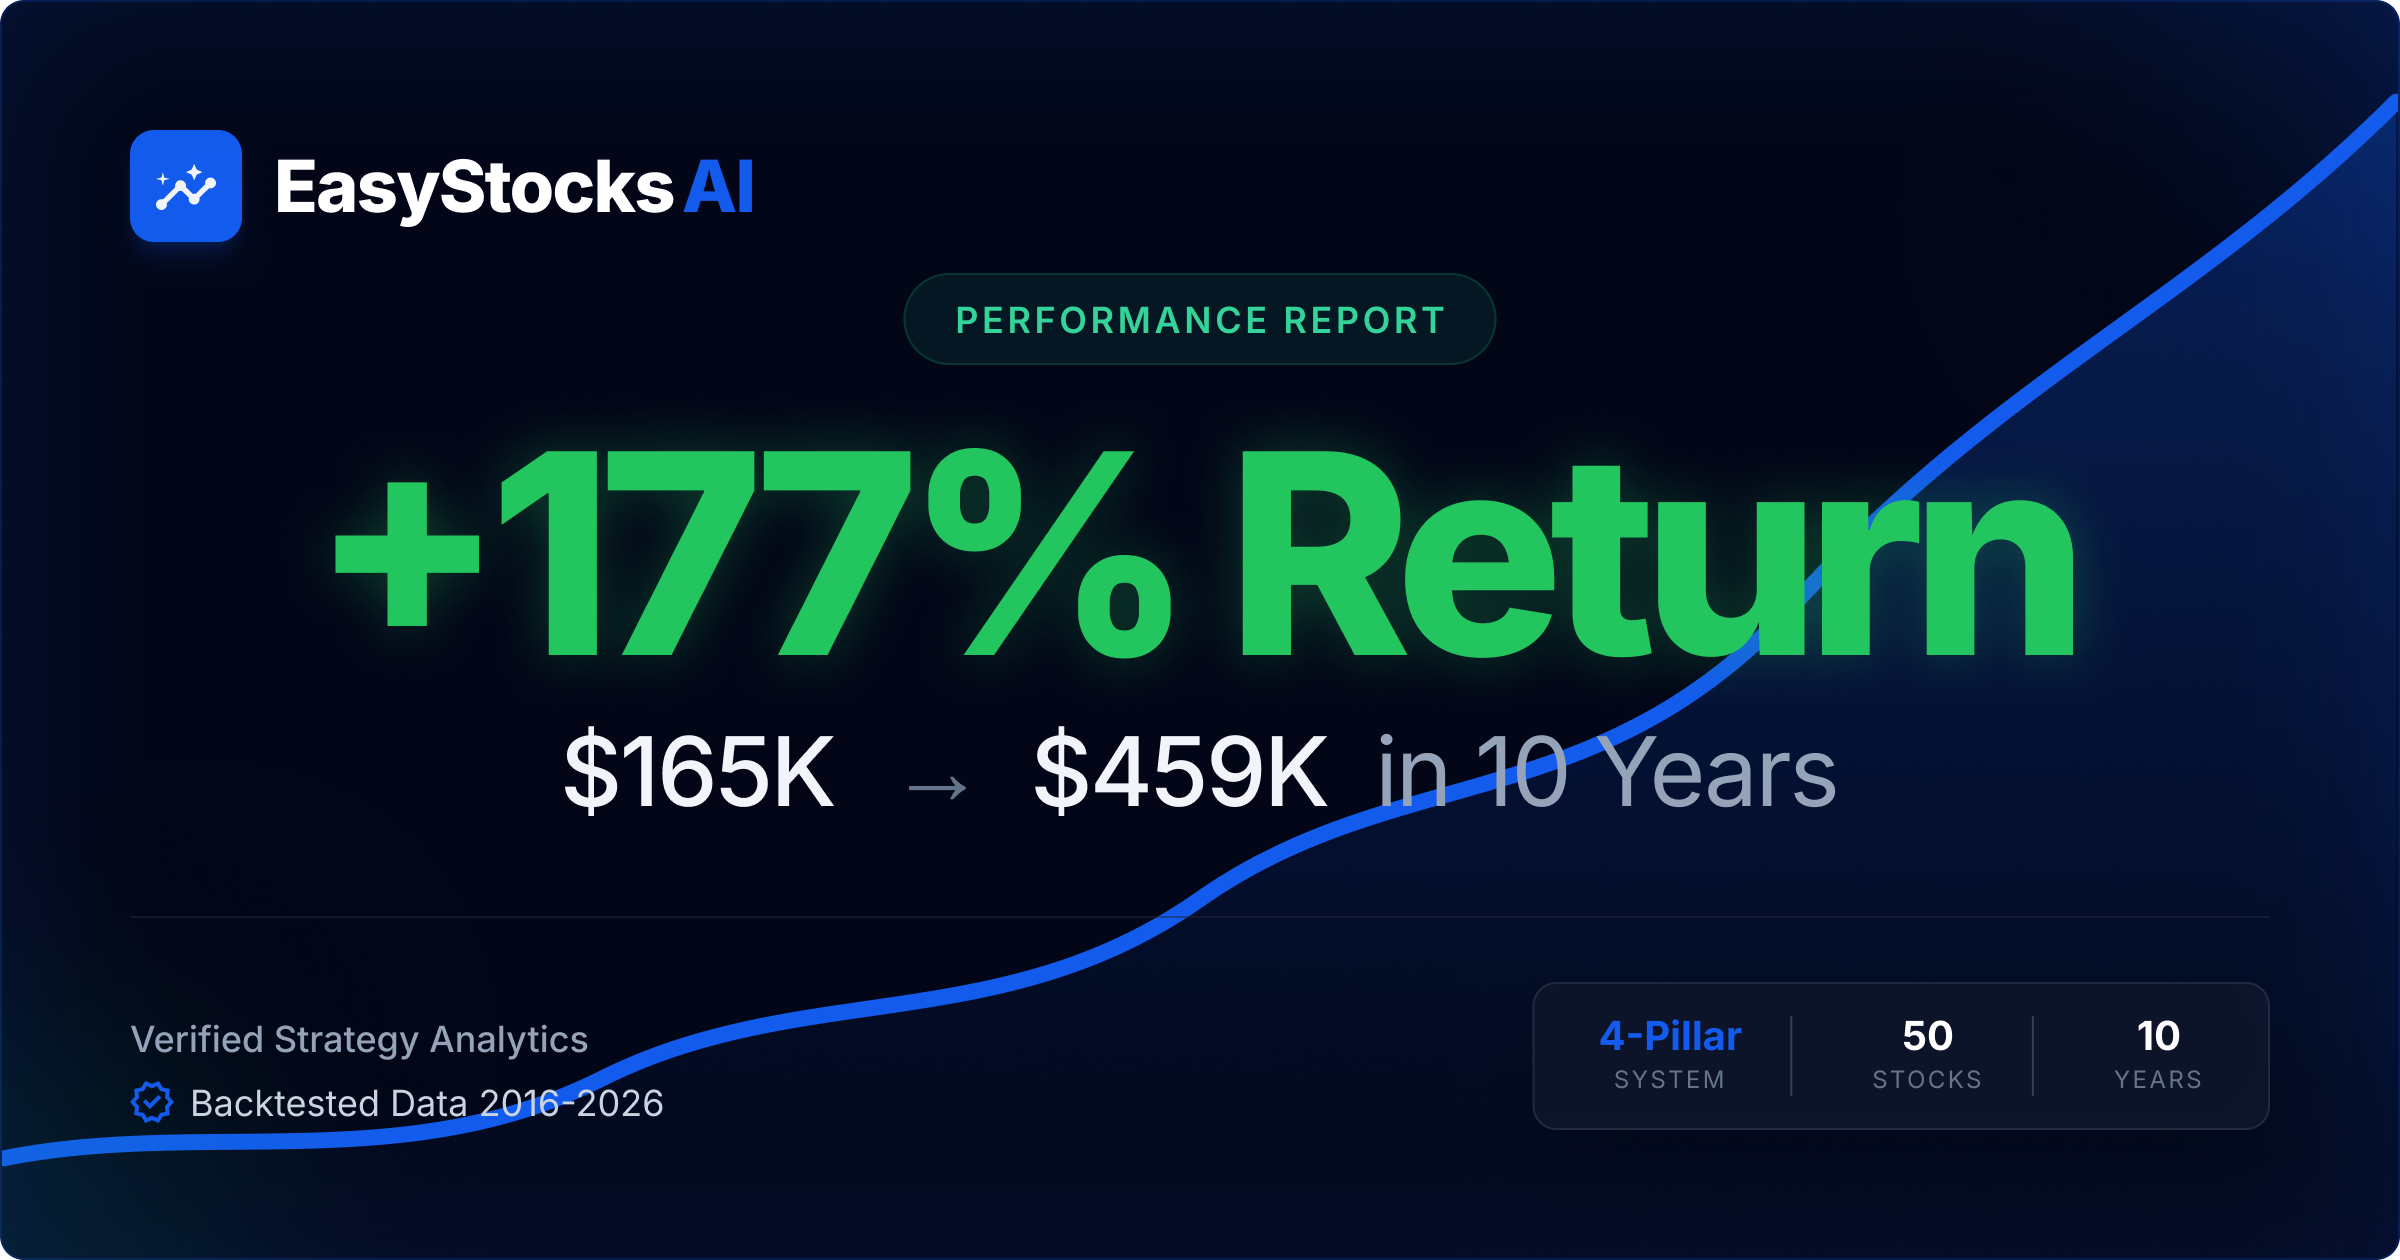
177% Return: How Our Scoring System Turned $165K Into $459K Over 10 Years
What if you had a system that could identify which S&P 500 stocks to buy each month — not based on hype or gut feeling, but on measurable financial fundamentals? We built exactly that, and then we tested it.
We ran a 10-year simulated portfolio starting in February 2016, investing $1,000 to $1,500 per month into the highest-scoring S&P 500 stocks according to EasyStocksAI’s 4-pillar scoring system. The results speak for themselves.
Total invested: $165,468 Final value: $458,707 Total return: +177% (~$293,000 profit)
For context, the S&P 500 itself returned approximately 170% over the same period. Our scoring-driven approach matched and slightly outperformed the index — while building a diversified portfolio of individual stocks with strong fundamentals, real dividend income, and significantly less downside risk during corrections.
The Strategy: Simple, Systematic, No Guesswork
The rules were straightforward:
- Each month, check which S&P 500 stocks score highest on EasyStocksAI
- Invest $1,000-$1,500 into the top-scoring stock
- Hold. Don’t sell based on emotion.
- Repeat every month for 10 years.
No day trading. No options. No trying to time the market. Just consistent monthly purchases guided by a scoring system that evaluates every stock on the same objective criteria.
119 transactions. 50 different stocks. 10 years of discipline.
How the 4-Pillar Scoring System Works
Every stock receives a score from 0 to 100, built from four equally weighted pillars of 25 points each:
Shareholder Returns (25 pts) — Does this company reward its shareholders? We measure dividend yield relative to the market, dividend growth rate, and payout sustainability. Companies that consistently grow dividends while maintaining healthy payout ratios score highest.
Growth Quality (25 pts) — Is the business actually growing? Revenue growth, earnings per share trajectory, and consistency of growth over multiple years. A stock can pay great dividends, but if the underlying business is shrinking, those dividends won’t last.
Valuation Quality (25 pts) — Are you overpaying? We compare the stock’s P/E ratio against its sector average, evaluate the Graham Number (a classic value investing metric), and check whether the current price reflects reasonable expectations. This pillar keeps the portfolio away from overhyped momentum plays.
Track Record & Resilience (25 pts) — Has the company proven itself through tough times? We look at how many consecutive years dividends have been paid, how the stock performed during economic crises (2008, 2020, etc.), and the company’s founding year. Younger companies haven’t been battle-tested; older ones with long dividend histories have.
A stock scoring 100/100 is exceptional across all four dimensions: it pays and grows dividends, the business is expanding, the stock isn’t overvalued, and it has survived economic storms. These are exactly the stocks our simulated portfolio targeted.
The Winners: What the Scoring System Found
Here are some of the standout holdings — stocks that the scoring system flagged as top picks, often well before they became obvious winners.
NVDA — NVIDIA (+27,183% vs S&P 500)
The portfolio started buying NVDA in early 2022, right before the AI revolution sent it parabolic. But the scoring system didn’t know about ChatGPT — it scored NVDA highly because of explosive revenue growth, strong earnings, and reasonable valuation relative to its growth rate. The fundamentals were screaming “buy” before the narrative caught up.
LRCX — Lam Research (+2,230% vs S&P 500)
Semiconductor equipment maker LRCX was a consistent top scorer thanks to its combination of strong dividend growth, excellent margins, and reasonable valuation. The scoring system identified it as early as September 2020, and subsequent purchases in 2022 and 2023 caught it at attractive entry points.
AMAT — Applied Materials (+1,055% vs S&P 500)
Another semiconductor equipment play that scored highly on growth quality and shareholder returns. AMAT was purchased in late 2018 — before the semiconductor shortage made these companies household names. The scoring system saw the dividend growth, the expanding margins, and the reasonable P/E.
PHM — PulteGroup (+607% vs S&P 500)
Homebuilder PHM is a perfect example of the scoring system finding value where most investors aren’t looking. Homebuilders aren’t glamorous, but PHM’s dividend growth, low P/E relative to its sector, and strong earnings trajectory gave it a perfect 100 score. Multiple purchases from 2021 to 2023 paid off handsomely.
STLD — Steel Dynamics (+582% vs S&P 500)
A steel manufacturer scoring 100/100 might surprise casual investors, but STLD checked every box: growing dividends, expanding revenue, attractive valuation, and a proven track record through economic cycles. The scoring system doesn’t have sector bias — it simply measures what matters.
DHI — D.R. Horton (+442% vs S&P 500)
Another homebuilder that the fundamentals-first approach identified. DHI was purchased in late 2023 and early 2024, and its strong score reflected consistent dividend increases, solid earnings growth, and a valuation well below sector peers.
MPC — Marathon Petroleum (+263% vs S&P 500)
Energy stocks are often dismissed by growth-focused investors, but MPC’s scoring told a different story: aggressive dividend growth, strong cash flow, and deep value pricing. The portfolio accumulated MPC shares across late 2022 and early 2023, catching the energy sector at a sweet spot.
Sector Diversification: A Natural Byproduct
One of the most interesting outcomes is how naturally diversified the portfolio became. By simply buying the highest-scoring stock each month, the portfolio spread across 10 different sectors:
- Technology — NVDA, LRCX, AMAT, AVGO, CSCO, QCOM, MU, HPQ, STX
- Consumer Discretionary — PHM, DHI, BLDR, DDS
- Energy — MPC, VLO
- Financials — JPM, MS, AFL, RJF, STT, RF
- Health Care — UNH, LLY, MOH, CAH
- Industrials — ETN, UNP, PCAR, JBL
- Materials — STLD, ALB, MOS
- Consumer Staples — KDP, ADM
- Communication Services — T, VZ
- Real Estate — PLD, CPT
The scoring system didn’t aim for diversification — it just bought whatever scored highest. But because the four pillars measure different aspects of quality, the system naturally rotated between sectors as valuations shifted and fundamentals evolved. When tech became expensive, materials or energy scored higher. When financials recovered from a crisis, banks moved up the rankings.
What About Downturns?
The portfolio lived through real market stress: the 2018 correction, the COVID-19 crash of March 2020, the 2022 bear market, and the banking sector turbulence of 2023. During each event, the scoring system’s Track Record & Resilience pillar proved its worth.
Companies with long dividend histories and proven crisis survival — like JPM, UNH, and AVGO — scored highly precisely when markets were panicking. The system kept buying fundamentally strong stocks at lower prices, which is exactly what you want during a downturn.
The monthly DCA approach meant the portfolio was always deploying capital, never sitting on the sidelines trying to “wait for the bottom.” Combined with quality-scoring, this created a systematic buy-the-dip strategy without requiring any market timing skill.
Key Takeaways
1. Fundamentals work. A scoring system based on dividends, growth, valuation, and resilience identified stocks like NVDA, LRCX, and AMAT — not because it predicted AI or semiconductor shortages, but because the financial metrics were strong.
2. Consistency beats timing. 119 monthly purchases over 10 years, no sells. The power of dollar-cost averaging into quality stocks compounds dramatically.
3. Diversification happens naturally. Following the score rather than chasing sectors produced a portfolio spread across 10 industries without any forced allocation rules.
4. Boring stocks win. Homebuilders (PHM, DHI), steel companies (STLD), petroleum refiners (MPC) — not the stocks making headlines, but stocks with perfect scores based on real financial strength.
5. The system removes emotion. No FOMO, no panic selling, no “this time is different.” Just buy the highest-scoring stock, every month, for a decade. The result: $293,000 in profit.
Try It Yourself
You can explore the full simulated portfolio — every holding, every sector allocation, the performance chart — at the shared portfolio link. The scores update daily, so you can see what the system would recommend buying today.
The scoring system is available for every S&P 500 stock on EasyStocksAI. Check the current top-scoring stocks and see which companies the fundamentals are favoring right now.
This article describes a simulated portfolio using historical data. Past performance does not guarantee future results. This is not financial advice — always do your own research before investing.