The All Weather Portfolio: How to Invest $1,300/Month and Actually Sleep at Night
Not everyone wants to ride a roller coaster with their savings. If the idea of watching your portfolio drop 30% in a bad year makes your stomach turn, the All Weather portfolio might be the strategy for you.
Invented by billionaire investor Ray Dalio — founder of Bridgewater Associates, the world’s largest hedge fund — the All Weather approach is built on one simple idea: no one can predict what the economy will do next. So instead of betting on one outcome, you spread your money across asset classes that perform well in different economic environments.
We built a 10-year simulated All Weather portfolio investing roughly $1,300 per month starting in February 2016. After 119 purchases and $159,735 invested, it grew to $191,534 — a steady 20% total return.
Total invested: $159,735 Final value: $191,534 Total return: +20% (~$31,800 profit)
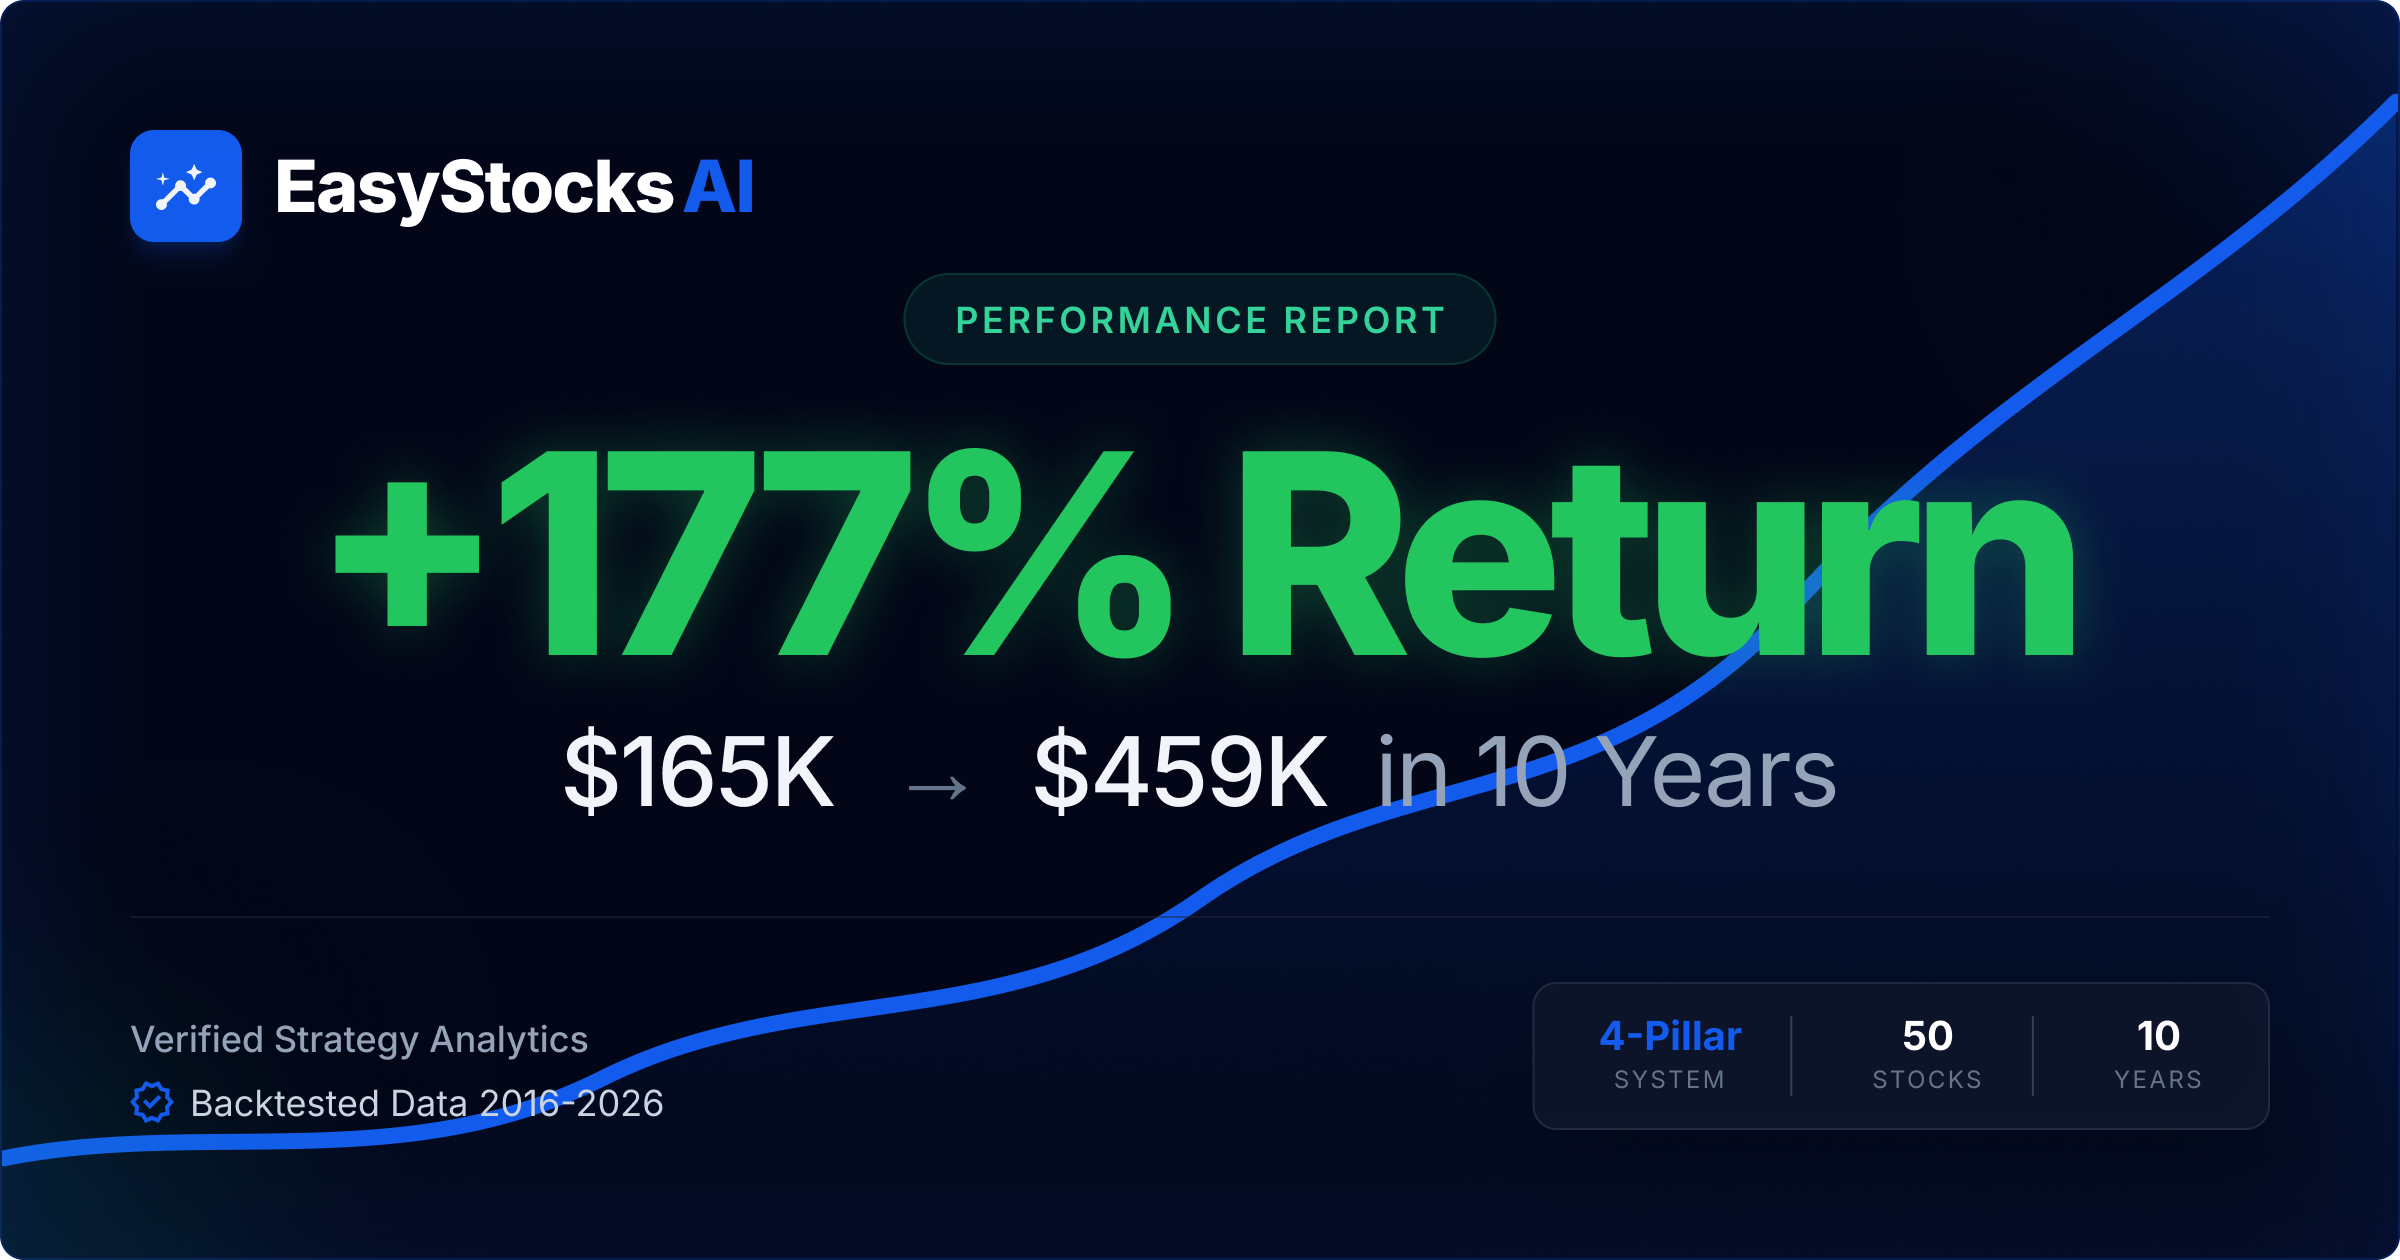
That might not sound as exciting as the 177% return from our S&P 500 scoring portfolio. And that’s exactly the point. The All Weather portfolio isn’t trying to beat the market — it’s trying to survive anything the market throws at it, while still growing your wealth over time.
The Four Economic Seasons
Ray Dalio’s key insight is that the economy cycles through four environments, and each one rewards different types of investments:
Rising Growth (economy expanding) — Stocks thrive. Businesses earn more, stock prices rise. This is the environment most people invest for.
Falling Growth (recession) — Bonds shine. When the economy slows, central banks cut interest rates, pushing bond prices up. Long-term government bonds are the classic safe haven.
Rising Inflation (prices increasing) — Commodities and gold win. When a dollar buys less tomorrow than today, physical assets hold their value. Gold has been a store of value for thousands of years.
Falling Inflation (prices stabilizing) — Both stocks and bonds tend to do well. This is the “Goldilocks” scenario that powered markets throughout 2017 and 2019.
The problem? Nobody knows which season is coming next. Even the best economists get it wrong constantly. So instead of guessing, the All Weather approach holds all four types of investments at once. Something in your portfolio is always working, even when other parts aren’t.
The Allocation: Why 40% Bonds?
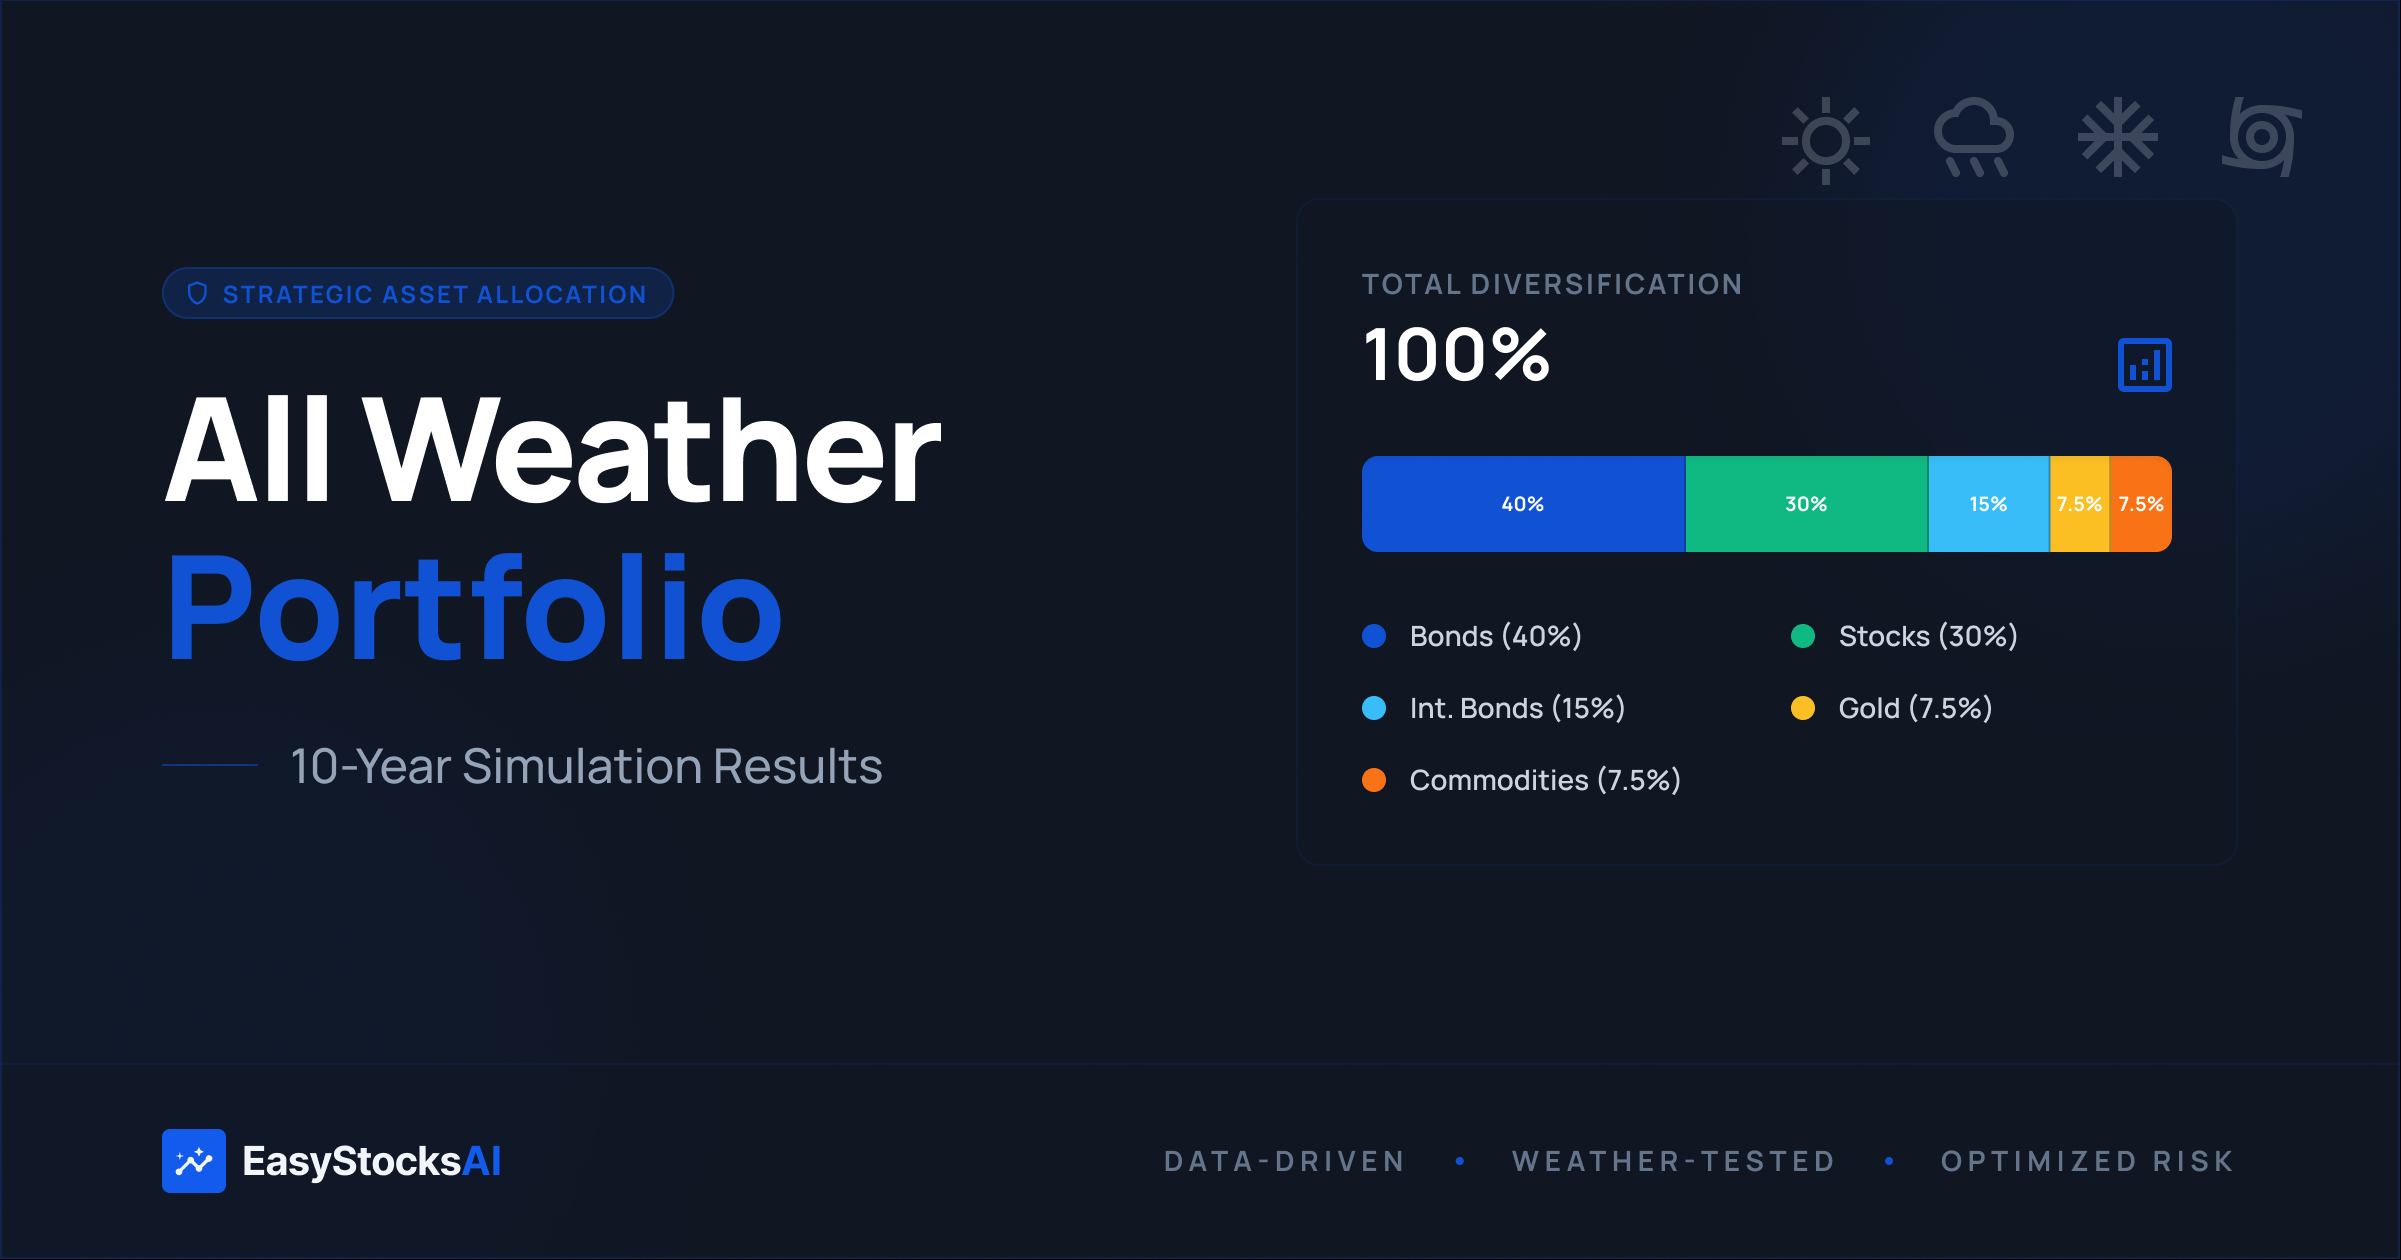
Here’s where it gets counterintuitive. The All Weather portfolio doesn’t split money equally between stocks and bonds. Instead, it uses this allocation:
| Asset Class | Target Weight | What It Is |
|---|---|---|
| Long-term bonds (TLT) | 40% | 20+ year U.S. Treasury bonds |
| Stocks | 30% | S&P 500 stocks (selected by EasyStocksAI score) |
| Intermediate bonds (IEI) | 15% | 3-7 year U.S. Treasury bonds |
| Gold (GLD) | 7.5% | Physical gold ETF |
| Commodities (DJP) | 7.5% | Broad commodity index |
Why so many bonds and so few stocks? Because stocks are much more volatile than bonds. A 30% stock allocation actually contributes about the same amount of risk as a 40% bond allocation. Dalio calls this “risk parity” — instead of balancing dollars, you’re balancing the amount of risk each asset class contributes.
Think of it like building a team: you wouldn’t put five strikers on a soccer field and call it balanced. You need defenders, midfielders, and a goalkeeper too — even though the strikers score the most goals. Bonds are the defenders. Gold is the goalkeeper. Stocks are the strikers.
How We Built the Simulation
Our simulation follows three simple rules:
Rule 1: Invest monthly. Every month from February 2016 through December 2025, we invested between $1,000 and $1,600.
Rule 2: Buy what’s underweight. Each month, the system checks which asset class is furthest below its target allocation and buys that. If bonds have dropped in value and are now below 40% of the portfolio, the system buys more TLT. If stocks have run up and gold is underweight, it buys GLD. This is automatic rebalancing through new purchases — no selling required.
Rule 3: Pick stocks with the highest EasyStocksAI score. When it’s time to buy stocks (the 30% allocation), the system doesn’t just buy an index fund. It picks the highest-scoring S&P 500 stock according to the EasyStocksAI 4-pillar scoring system — the same system that produced our 177% return portfolio. But it favors defensive sectors like healthcare, consumer staples, and financials over growth sectors like technology.
Over 10 years, this produced 119 transactions across 23 different holdings.
The Stock Picks: Defensive Quality
The All Weather stock selection isn’t random. It uses modified sector weights that tilt toward defensive, recession-resistant businesses:
| Sector | All Weather Weight | S&P 500 Weight |
|---|---|---|
| Health Care | 18% | 13% |
| Consumer Staples | 15% | 6% |
| Technology | 15% | 30% |
| Utilities | 12% | 3% |
| Financials | 10% | 13% |
| Industrials | 10% | 8% |
Notice the difference: the S&P 500 puts 30% in technology. The All Weather approach cuts that in half and reallocates to healthcare, consumer staples, and utilities — sectors that people depend on regardless of economic conditions. People buy medicine, groceries, and electricity whether the economy is booming or busting.
Here are some of the stocks the scoring system chose:
JPM — JPMorgan Chase ($3,651 invested) — The largest U.S. bank, with a 200+ year history and consistent dividend growth. A cornerstone financial holding.
KDP — Keurig Dr Pepper ($6,365 invested) — The portfolio’s largest stock holding. Coffee and soft drinks — products people buy in any economy. Consumer staples are the backbone of an All Weather portfolio.
LLY — Eli Lilly ($1,075 invested) — One of the best-performing stocks in the portfolio. Healthcare doesn’t stop during recessions, and LLY’s growth trajectory has been remarkable.
UNP — Union Pacific ($3,351 invested) — Railroads move goods across America regardless of which sector is hot. UNP combines industrial stability with strong dividend growth.
STLD — Steel Dynamics ($4,416 invested) — A materials company that scored 100/100 on EasyStocksAI. Strong dividends, growing revenue, and attractive valuation. Not glamorous, but exactly the kind of company that belongs in a resilient portfolio.
The 19 stock holdings span all 10 S&P 500 sectors — from NFLX in Communication Services to MPW in Real Estate — providing broad diversification within the 30% stock allocation.
Year by Year: The Reality
Let’s look at how the portfolio actually performed, year by year:
| Year | Year-End Value | New Money Invested | Notes |
|---|---|---|---|
| 2016 | $22,045 | $22,150 | Starting year — mostly deploying cash |
| 2017 | $38,026 | $12,711 | Stocks and bonds both rose |
| 2018 | $46,891 | $13,314 | Slight dip — stocks fell, bonds cushioned |
| 2019 | $70,316 | $13,767 | Strong year — everything rallied |
| 2020 | $95,280 | $14,066 | COVID crash and recovery |
| 2021 | $120,835 | $14,069 | Bull market peak |
| 2022 | $111,959 | $15,116 | Value dropped despite adding $15K |
| 2023 | $133,759 | $16,426 | Recovery year |
| 2024 | $152,984 | $18,402 | Steady growth |
| 2025 | $186,381 | $19,715 | Strong finish |
The standout row is 2022. The portfolio went from $120,835 to $111,959 — a decline — even though $15,116 of new money was added. That means the market wiped out about $24,000 in value that year.
The Honest Truth: 2022 Exposed the Weakness
Let’s address the elephant in the room. In 2022, the Federal Reserve aggressively raised interest rates to fight inflation. This created the one scenario that hurts All Weather portfolios the most: stocks and bonds falling simultaneously.
TLT — the long-term bond ETF that makes up 40% of the portfolio — dropped roughly 30% in 2022. At the same time, the stock market fell about 19%. Gold held steady, and commodities rose, but 7.5% allocations in gold and commodities couldn’t offset losses in the 70% allocated to stocks and bonds.
This is important to understand: the All Weather portfolio is designed for normal economic cycles where stocks and bonds move in opposite directions. The 2022 rate-hiking cycle broke that relationship temporarily. It was a genuine stress test, and the portfolio felt the pain.
But here’s the other side: by the end of 2023, the portfolio had fully recovered and then some, reaching $133,759. The system kept buying TLT at lower prices throughout 2022 and 2023, which positioned the portfolio for the recovery. That’s the power of systematic monthly investing — you automatically buy more when prices are low.
All Weather vs. Pure Stocks: Different Goals
Our S&P 500 scoring portfolio returned 177% over the same period. The All Weather portfolio returned 20%. That’s a massive gap. So why would anyone choose All Weather?
Because returns aren’t everything.
The S&P 500 portfolio had months where it dropped 15-20% in value. The All Weather portfolio’s worst drawdowns were smaller because bonds and gold cushioned the fall. For someone who is retired, approaching retirement, or simply can’t afford to lose a large chunk of their savings, that stability is worth the trade-off in returns.
Think of it this way:
- Pure stocks = higher ceiling, lower floor. Great if you have decades ahead and strong nerves.
- All Weather = lower ceiling, higher floor. Better if you need stability or can’t stomach big drops.
The right choice depends entirely on your situation, your age, and how you’d actually react to a 30% portfolio drop. Most people overestimate their risk tolerance until they experience a real crash.
Who Should Consider All Weather?
The All Weather approach makes sense if you:
- Are within 10-15 years of retirement and can’t afford a major drawdown right before you need the money
- Want a hands-off strategy that doesn’t require watching markets daily
- Value consistency over maximum returns — you’d rather grow steadily than swing wildly
- Are just getting started and want to learn investing without the stress of an all-stock portfolio
- Have already built wealth and want to preserve it rather than maximize growth
It’s probably not for you if you’re in your 20s or 30s with a high risk tolerance and decades until retirement. At that stage, the growth you’d sacrifice by holding 55% in bonds and gold could cost you significantly over a career of investing.
How to Build Your Own
You don’t need to replicate our exact simulation. Here’s the simplified version:
- Split your monthly investment roughly: 40% into TLT, 15% into IEI, 7.5% into GLD, 7.5% into DJP, and 30% into stocks
- For the stock portion, check EasyStocksAI for the highest-scoring S&P 500 stocks, favoring defensive sectors (healthcare, consumer staples, utilities, financials)
- Each month, buy whatever’s most underweight. If bonds dropped this month, buy more bonds. If stocks rallied, buy more of the lagging assets. This keeps you roughly on target without ever selling.
- Don’t sell during downturns. The entire point is that the system handles bad markets through diversification, not market timing.
You can explore the full simulated All Weather portfolio — every holding, every transaction, the full performance chart — and see how the allocation evolved over 10 years.
The Bottom Line
The All Weather portfolio won’t make you rich quickly. It returned 20% over 10 years compared to the S&P 500’s roughly 170%. But it did what it was designed to do: it grew your money in every economic environment without requiring you to predict the future.
$159,735 became $191,534. Not flashy — but steady, diversified, and resilient. For many investors, that peace of mind is worth more than chasing maximum returns.
Ray Dalio built this strategy because he wanted a portfolio he could hand to his family and say: “This will be fine no matter what happens.” After simulating 10 years of real market data — including a global pandemic, a historic rate-hiking cycle, and two bear markets — we think that promise holds up.
This article describes a simulated portfolio using historical data. Past performance does not guarantee future results. This is not financial advice — always do your own research before investing.