Dividend Aristocrats are the S&P 500’s most reliable income machines — companies that have raised their dividends for at least 25 consecutive years. Through recessions, pandemics, and market crashes, these businesses kept writing bigger checks to shareholders every single year.
But not all Aristocrats are created equal. Some are thriving. Others are hanging on by a thread. We used EasyStocksAI’s 4-pillar scoring system to rank all 59 Dividend Aristocrats in the S&P 500, analyzing dividends, growth quality, valuation, and crisis resilience to find the best dividend stocks for 2026.
Here’s what the data says.
How We Scored 59 Dividend Aristocrats
EasyStocksAI evaluates every S&P 500 stock across four pillars, each worth 25 points (100 total):
| Pillar | What It Measures | Key Metrics |
|---|---|---|
| Shareholder Returns (25 pts) | How well the company rewards investors | Dividend yield, buybacks, return consistency, payment regularity |
| Growth Quality (25 pts) | Whether the business is actually growing | Revenue CAGR, earnings CAGR, profit margins, return on equity |
| Valuation Quality (25 pts) | Is it reasonably priced? | P/E vs sector, Graham ratio, price stability, earnings yield |
| Track Record & Resilience (25 pts) | Can it survive anything? | 10Y performance vs S&P 500, 10Y vs sector ETF, crisis survival count |
A stock scoring 70+ is exceptional. Most Dividend Aristocrats score between 40-60 — respectable, but not outstanding. The ones at the top combine all four qualities: generous returns, real growth, fair valuation, and battle-tested resilience.
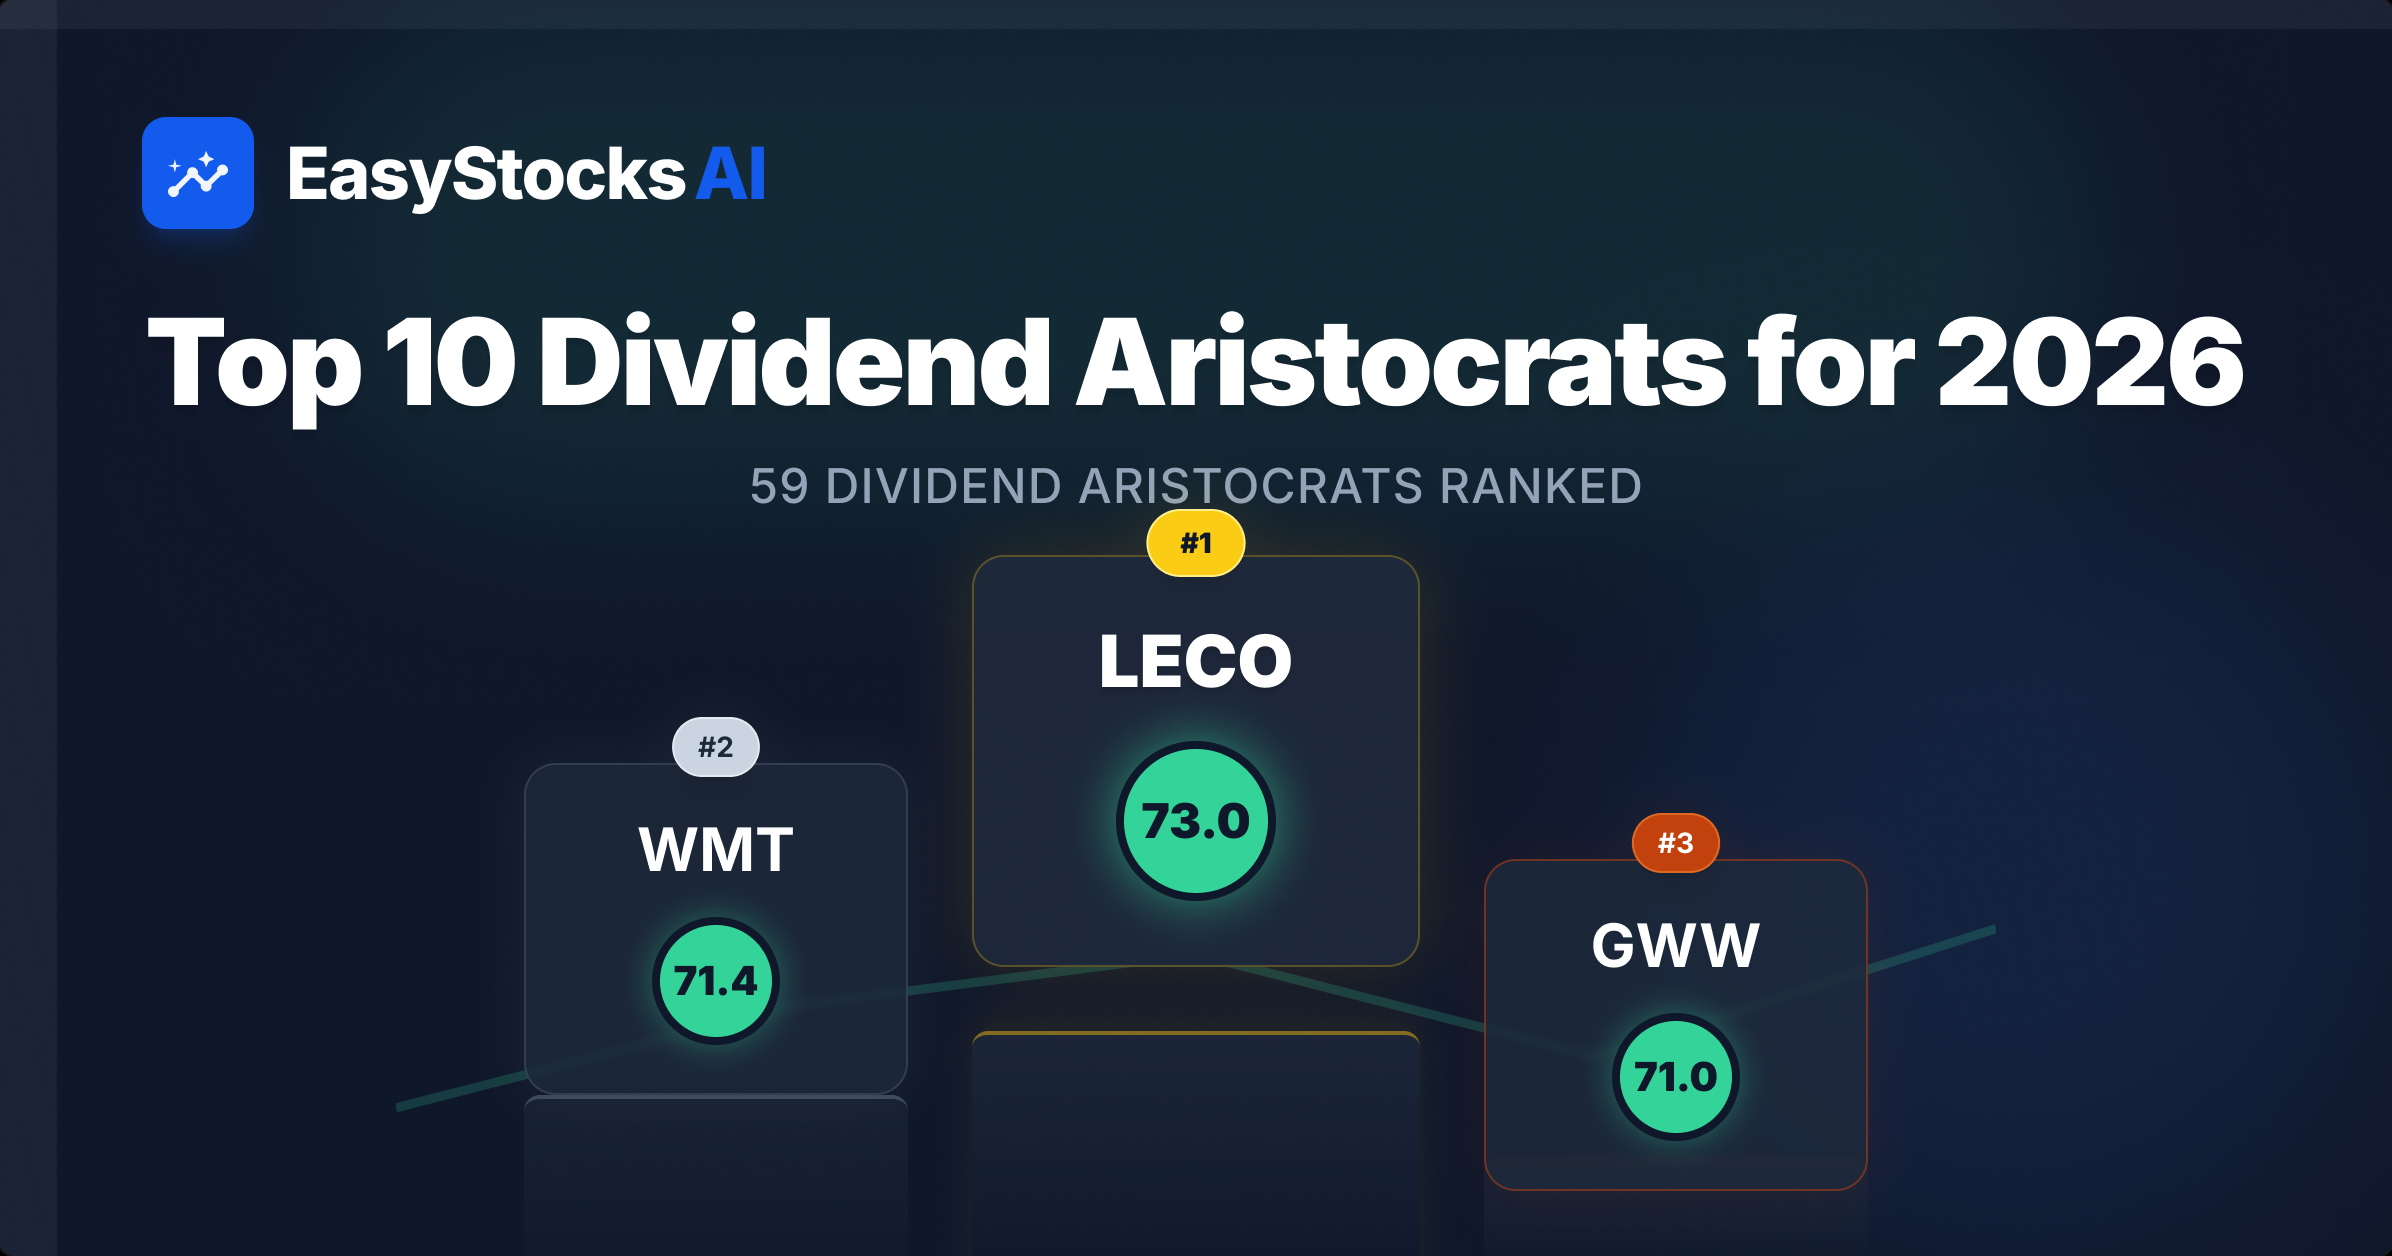
The Top 10 Dividend Aristocrats for 2026
1. LECO — Lincoln Electric Holdings (Score: 73.0/100)
Sector: Industrials | Yield: 1.14% | P/E: 28.65 | Dividend Streak: 31 years | Crises Survived: 5
The world’s largest manufacturer of welding products takes the top spot with an impressive combination of long-term market outperformance and strong earnings growth. Lincoln Electric has quietly delivered outstanding returns while growing earnings at a 26.1% CAGR and revenue at 12.4% CAGR over 5 years. A 3.6% total shareholder yield and 34.7% ROE reflect disciplined capital allocation.
Why it scores so high: Outstanding long-term performance — +81.3% vs the S&P 500 and +178.4% vs its sector ETF over 10 years. Strong capital efficiency with a 12.3% margin and P/E sitting 42% below the industrial sector average. The Graham ratio is 35.9% below sector average. The sentiment score of 80 reflects strong bullish momentum.
The catch: Only 5 crises survived (out of 11 tracked) — Lincoln Electric is less battle-tested than many companies below it. The 1.14% yield is modest, and the shorter 31-year streak makes it one of the youngest Aristocrats on this list.
2. WMT — Walmart Inc. (Score: 71.4/100)
Sector: Consumer Staples | Yield: 0.75% | P/E: 45.23 | Dividend Streak: 50 years | Crises Survived: 10
Walmart slips to #2 but remains one of the highest-quality Aristocrats on the board. The world’s largest retailer has survived every major economic crisis of the past four decades while consistently growing revenue and delivering massive outperformance vs the S&P 500 over 10 years. A staggering 67.5% total shareholder yield (dominated by buybacks) tells the capital return story.
Why it scores so high: Perfect crisis resilience, 10/10 on return consistency (50 consecutive years of positive returns), and strong dividend growth (13.0% YoY) that means the low yield compounds rapidly. Revenue growing at 6.2% CAGR with 12.8% earnings CAGR. The 34.4% payout ratio leaves enormous room for future increases. An incredible +191% vs SPY and +449.9% vs sector ETF over 10 years.
The catch: At a P/E of 45.23, you’re paying up for quality. The P/E is 30% below sector average, but still rich in absolute terms. This is a stock you buy for the next 20 years, not for income today.
3. GWW — W.W. Grainger (Score: 71.0/100)
Sector: Industrials | Yield: 0.82% | P/E: 31.37 | Dividend Streak: 42 years | Crises Survived: 11
The industrial distributor that nobody talks about at dinner parties — and that’s exactly why it works. Grainger supplies maintenance, repair, and operating products to businesses. When a factory needs parts, they call Grainger. Recession or boom, factories need parts.
Why it scores so high: Maximum crisis resilience (11 crises survived — every single one we track). Revenue growing at 11.1% CAGR with an explosive 25.2% earnings CAGR. A 44.9% ROE and 9.5% margin show operational excellence. The P/E of 31.37 sits 41.4% below the industrial sector average. A 42-year dividend streak with a sentiment score of 80 signals strong momentum. Over 10 years, +116.9% vs SPY and +214% vs sector ETF.
The catch: Like Walmart, the yield is under 1%. Recent returns have pulled back (-4.7% 5Y CAGR). You’re buying Grainger for total return and reliability, not current income.
4. AFL — Aflac Incorporated (Score: 67.8/100)
Sector: Financials | Yield: 2.13% | P/E: 16.03 | Dividend Streak: 43 years | Crises Survived: 10
The supplemental insurance giant is the first Aristocrat on our list with a meaningful yield. At 2.13% with a P/E of just 16.03, Aflac offers what income investors actually want: a decent yield at a cheap price with a decades-long track record. The 7.5% total shareholder yield is among the best on this list.
Why it scores so high: Valuation is the star here — P/E is 78.8% below the financial sector average, and the Graham ratio sits 84.4% below average. The 13.0% dividend growth rate and low 34.5% payout ratio mean Aflac can keep raising that dividend for years. Has survived 10 of 11 crises and +120.2% vs sector ETF over 10 years.
The catch: Has underperformed the S&P 500 over 10 years. Aflac is cheap for a reason — growth has been inconsistent. You’re betting on valuation and cash returns, not a growth story.
5. BRO — Brown & Brown Inc. (Score: 67.0/100)
Sector: Financials | Yield: 0.92% | P/E: 21.64 | Dividend Streak: 40 years | Crises Survived: 10
The insurance brokerage firm is one of the most consistent compounders in the financial sector. Brown & Brown has built a 40-year dividend streak through disciplined acquisitions and organic growth, delivering 12.5% dividend growth while keeping the payout ratio at a remarkably low 19.9%.
Why it scores so high: Exceptional capital discipline — the 19.9% payout ratio is among the lowest of any Aristocrat, meaning BRO could multiply its dividend many times over from earnings alone. Impressive 22.6% revenue CAGR and 21.7% earnings CAGR show genuine business momentum. The P/E of 21.64 is 36.4% below sector average — reasonable for a high-quality financial compounder, and 10 crises survived demonstrates genuine resilience.
The catch: The sub-1% yield won’t satisfy income seekers, and the sentiment score of 20 suggests near-term bearish pressure. This is a long-term compounder, not a current income play.
6. DOV — Dover Corporation (Score: 67.0/100)
Sector: Industrials | Yield: 0.99% | P/E: 26.39 | Dividend Streak: 45 years | Crises Survived: 10
Dover is a diversified industrial manufacturer with 45 consecutive years of positive returns — one of the longest streaks in our database. The company makes everything from fuel pumps to food packaging equipment, providing natural diversification across end markets. A 1.7% total shareholder yield with 4.9% revenue CAGR and 12.5% earnings CAGR show steady momentum.
Why it scores so high: Strong valuation scores — P/E is 56.5% below sector average. The payout ratio of just 26% means Dover could quadruple its dividend from earnings alone. Over 10 years, +20.7% vs SPY and +117.8% vs sector ETF.
The catch: The sub-1% yield and modest 1.0% dividend growth may disappoint income-focused investors. Dover is a total-return industrial compounder, not an income stock.
7. SON — Sonoco Products (Score: 67.0/100)
Sector: Consumer Discretionary | Yield: 3.98% | P/E: 8.97 | Dividend Streak: 37 years | Crises Survived: 9
The industrial packaging company offers a rare combination in this list: a near-4% yield with a single-digit P/E. Sonoco makes consumer and industrial packaging, from composite cans to rigid plastics, serving stable end markets that generate consistent cash flow. A 4.0% total shareholder yield and explosive 48.3% earnings CAGR round out the picture.
Why it scores so high: Deep value is the story — a P/E of just 8.97, which is 52.7% below sector average, makes Sonoco one of the cheapest Aristocrats on the entire list. Revenue is growing at a 9.5% CAGR. The 3.98% yield is among the highest in the top 10, and the sentiment score of 80 signals strong bullish momentum. The 37-year dividend streak through 9 economic crises proves this business can weather storms.
The catch: The packaging industry faces secular headwinds from sustainability trends. The modest 1.9% dividend growth rate and 35.8% payout ratio are serviceable but not exciting. Sonoco is a value play, not a growth story — you’re collecting a fat yield while waiting for the market to reprice.
8. JNJ — Johnson & Johnson (Score: 66.2/100)
Sector: Health Care | Yield: 2.13% | P/E: 22.01 | Dividend Streak: 51 years | Crises Survived: 11
The healthcare giant needs no introduction. With 51 consecutive years of positive returns and dividend increases, JNJ is the definition of reliability. It’s survived every single crisis we track — 11 out of 11 — making it one of only a handful of stocks with a perfect crisis survival record.
Why it scores so high: Maximum crisis resilience, strong margins, and solid valuation (P/E 45.3% below sector average). Revenue growing at 2.3% CAGR with 10% earnings CAGR. The 2.13% yield with quarterly payments and a 47.1% payout ratio is the classic “widow and orphan” stock profile. Over 10 years, +32.8% vs sector ETF.
The catch: J&J has underperformed the S&P 500 over 10 years, dragged down by litigation headlines and the Kenvue spinoff. The modest 4.8% dividend growth rate tells the story of a company in transition. You’re buying for stability, not growth.
9. O — Realty Income Corporation (Score: 66.0/100)
Sector: Real Estate | Yield: 4.98% | P/E: 55.31 | Dividend Streak: 33 years | Crises Survived: 10
“The Monthly Dividend Company” lives up to its nickname with a nearly 5% yield and monthly dividend payments — making it a favorite among income investors who want regular cash flow. Realty Income has raised its dividend for 33 consecutive years while surviving 10 of 11 tracked economic crises. Revenue is growing at a remarkable 36.6% CAGR with 27.9% earnings CAGR.
Why it scores so high: The combination of a 5.0% total shareholder yield, monthly payments, and 33 consecutive years of increases is hard to find anywhere. P/E sits 31.3% below the real estate sector average. The 10/10 return consistency score and strong crisis resilience add defensive quality.
The catch: The P/E of 55.31 looks alarming, and the payout ratio of 276.4% (based on EPS) appears unsustainable — though REITs are properly valued on FFO (funds from operations). Realty Income has significantly underperformed the S&P 500 over 10 years. This is a pure income play, not a growth investment.
10. NDSN — Nordson Corporation (Score: 65.8/100)
Sector: Industrials | Yield: 1.17% | P/E: 29.62 | Dividend Streak: 40 years | Crises Survived: 10
Nordson makes precision dispensing, coating, and surface treatment equipment — niche industrial products that customers can’t easily substitute. With 40 consecutive years of positive returns and a balanced scorecard across all four pillars, Nordson is the quiet compounder that few retail investors know about. A 2.4% total shareholder yield with 19.9% 5Y returns CAGR show this stock rewards patient holders.
Why it scores so high: Balanced excellence — revenue growing at 7.1% CAGR with an impressive 18% earnings CAGR. The P/E of 29.62 sits 30.9% below the industrial sector average. Has survived 10 of 11 tracked crises, proving resilience across decades. The 42.9% dividend growth rate is the highest of any stock in the top 10.
The catch: The 1.17% yield is modest, and the 34.6% payout ratio means you’re relying on capital appreciation for most of your return. At a P/E above 29, it’s not a deep value play.
The Full Scoreboard: All 59 Aristocrats Ranked
Here’s every Dividend Aristocrat in the S&P 500, ranked by EasyStocksAI score:
| Rank | Ticker | Company | Sector | Score | Yield | Streak | Crises |
|---|---|---|---|---|---|---|---|
| 1 | LECO | Lincoln Electric | Industrials | 73.0 | 1.14% | 31yr | 5 |
| 2 | WMT | Walmart | Consumer Staples | 71.4 | 0.75% | 50yr | 10 |
| 3 | GWW | W.W. Grainger | Industrials | 71.0 | 0.82% | 42yr | 11 |
| 4 | AFL | Aflac | Financials | 67.8 | 2.13% | 43yr | 10 |
| 5 | BRO | Brown & Brown | Financials | 67.0 | 0.92% | 40yr | 10 |
| 6 | DOV | Dover Corp | Industrials | 67.0 | 0.99% | 45yr | 10 |
| 7 | SON | Sonoco Products | Consumer Discr. | 67.0 | 3.98% | 37yr | 9 |
| 8 | JNJ | Johnson & Johnson | Health Care | 66.2 | 2.13% | 51yr | 11 |
| 9 | O | Realty Income | Real Estate | 66.0 | 4.98% | 33yr | 10 |
| 10 | NDSN | Nordson | Industrials | 65.8 | 1.17% | 40yr | 10 |
| 11 | ATO | Atmos Energy | Utilities | 65.7 | 2.04% | 38yr | 11 |
| 12 | ADM | Archer-Daniels-Midland | Consumer Staples | 64.1 | 2.95% | 44yr | 11 |
| 13 | IBM | IBM | Technology | 64.0 | 2.69% | 51yr | 11 |
| 14 | LOW | Lowe’s | Consumer Discr. | 63.1 | 1.89% | 42yr | 10 |
| 15 | NNN | NNN REIT | Real Estate | 63.0 | 5.25% | 37yr | 8 |
| 16 | PNR | Pentair | Industrials | 63.0 | 1.13% | 37yr | 10 |
| 17 | ES | Eversource Energy | Utilities | 62.5 | 4.14% | 28yr | 11 |
| 18 | CVX | Chevron | Energy | 61.1 | 3.71% | 43yr | 11 |
| 19 | XOM | Exxon Mobil | Energy | 60.8 | 2.73% | 51yr | 11 |
| 20 | LIN | Linde | Materials | 60.0 | 1.26% | 34yr | 11 |
| 21 | UGI | UGI Corp | Utilities | 60.0 | 4.14% | 40yr | 11 |
| 22 | AOS | A.O. Smith | Industrials | 59.1 | 2.01% | 41yr | 11 |
| 23 | GPC | Genuine Parts | Consumer Discr. | 59.0 | 3.81% | 44yr | 11 |
| 24 | ITW | Illinois Tool Works | Industrials | 58.5 | 2.28% | 39yr | 11 |
| 25 | ED | Con Edison | Utilities | 58.0 | 3.09% | 51yr | 11 |
| 26 | EXPD | Expeditors Intl | Industrials | 58.0 | 1.09% | 33yr | 9 |
| 27 | ROST | Ross Stores | Consumer Discr. | 57.9 | 0.76% | 32yr | 9 |
| 28 | GGG | Graco | Industrials | 57.3 | 1.27% | 40yr | 9 |
| 29 | MSA | MSA Safety | Industrials | 57.1 | 1.16% | 37yr | 11 |
| 30 | DCI | Donaldson | Industrials | 57.0 | 1.35% | 40yr | 9 |
| 31 | MMM | 3M | Industrials | 57.0 | 1.91% | 51yr | 11 |
| 32 | PPG | PPG Industries | Materials | 57.0 | 2.65% | 44yr | 11 |
| 33 | NFG | National Fuel Gas | Energy | 56.4 | 2.33% | 39yr | 10 |
| 34 | TGT | Target | Consumer Staples | 56.2 | 3.76% | 44yr | 11 |
| 35 | SWK | Stanley Black & Decker | Industrials | 56.0 | 4.47% | 42yr | 11 |
| 36 | MCD | McDonald’s | Consumer Discr. | 54.5 | 2.21% | 51yr | 10 |
| 37 | NEE | NextEra Energy | Utilities | 54.1 | 2.54% | 44yr | 11 |
| 38 | EMR | Emerson Electric | Industrials | 54.0 | 1.55% | 51yr | 11 |
| 39 | WTRG | Essential Utilities | Utilities | 54.0 | 3.43% | 40yr | 9 |
| 40 | CASY | Casey’s General Stores | Consumer Discr. | 53.5 | 0.32% | 37yr | 8 |
| 41 | RTX | RTX Corp | Industrials | 53.2 | 1.31% | 51yr | 11 |
| 42 | LEG | Leggett & Platt | Consumer Discr. | 53.0 | 1.90% | 39yr | 11 |
| 43 | ATR | AptarGroup | Health Care | 51.5 | 1.41% | 34yr | 5 |
| 44 | ESS | Essex Property Trust | Real Estate | 48.8 | 4.04% | 32yr | 10 |
| 45 | OZK | Bank OZK | Financials | 48.6 | 4.00% | 29yr | 5 |
| 46 | CAH | Cardinal Health | Health Care | 47.7 | 0.94% | 41yr | 10 |
| 47 | SHW | Sherwin-Williams | Materials | 47.3 | 0.96% | 42yr | 11 |
| 48 | SO | Southern Company | Utilities | 47.2 | 3.07% | 45yr | 10 |
| 49 | BDX | Becton Dickinson | Health Care | 47.0 | 2.14% | 44yr | 11 |
| 50 | DOC | Physicians Realty Trust | Real Estate | 46.0 | 6.45% | 40yr | 8 |
| 51 | PEP | PepsiCo | Consumer Staples | 45.1 | 3.54% | 51yr | 10 |
| 52 | MKC | McCormick | Consumer Staples | 45.0 | 2.89% | 40yr | 11 |
| 53 | CHD | Church & Dwight | Consumer Staples | 41.1 | 1.18% | 37yr | 11 |
| 54 | CL | Colgate-Palmolive | Consumer Staples | 41.0 | 2.25% | 51yr | 11 |
| 55 | WST | West Pharma Services | Health Care | 39.7 | 0.37% | 40yr | 11 |
| 56 | VFC | VF Corp | Consumer Discr. | 37.4 | 2.12% | 41yr | 10 |
| 57 | CLX | Clorox | Consumer Staples | 37.0 | 4.26% | 44yr | 11 |
| 58 | APD | Air Products | Materials | 34.0 | 2.60% | 44yr | 10 |
| 59 | SJM | J.M. Smucker | Consumer Staples | 32.0 | 4.04% | 27yr | 11 |
What the Data Reveals
High Yield ≠ High Quality
The highest-yielding Aristocrats tend to score poorly. DOC (6.45%), NNN (5.25%), and O (4.98%) offer big yields but mixed overall quality. Meanwhile, the top-scoring stocks (LECO, WMT, GWW) all yield around 1% or less. The lesson: the best dividend stocks grow their payouts so fast that today’s low yield becomes tomorrow’s high yield.
Industrials Dominate
15 of the 59 Aristocrats — over 25% — come from the Industrials sector. Companies like LECO, GWW, DOV, NDSN, ITW, and EMR share a common profile: essential products, steady demand cycles, and the operational discipline to raise dividends through every environment. Five of the top 10 are Industrials.
The Crisis Test Separates Contenders from Pretenders
Our scoring system tracks how many economic crises each company survived while maintaining dividend growth. The maximum in our database is 11 crises (spanning from the early 1980s recession through COVID-19 and the 2022 rate shock).
11 crises survived (perfect score): GWW, JNJ, ATO, ADM, IBM, CVX, XOM, LIN, UGI, AOS, GPC, ITW, ED, MSA, MMM, PPG, SWK, TGT, NEE, EMR, RTX, LEG, SHW, SO, BDX, MKC, CHD, CL, WST, ES, CLX, SJM
Companies with fewer crises survived aren’t necessarily bad businesses — they may simply not have been paying dividends during earlier crises, or they were founded more recently. But the data gives a clear signal about which companies have truly battle-tested dividend policies.
The Best Blend of Yield + Quality
If you want both a meaningful yield AND a strong score, here are the Aristocrats that balance both:
| Ticker | Score | Yield | The Case |
|---|---|---|---|
| SON | 67.0 | 3.98% | Deep value (P/E 8.97), 37-year streak, bullish momentum |
| AFL | 67.8 | 2.13% | Cheap valuation, 43-year streak, 13% dividend growth |
| JNJ | 66.2 | 2.13% | Healthcare stalwart, 51-year streak, 11/11 crises |
| O | 66.0 | 4.98% | Monthly dividends, 33-year streak, REIT tax advantages |
| NNN | 63.0 | 5.25% | Triple-net REIT, 5.3% yield, 37-year streak |
| TGT | 56.2 | 3.76% | Beaten-down retailer, P/E of 14.61, 44-year streak |
How to Use This Data
For income seekers: Focus on NNN, O, SON, UGI, TGT, and AFL for current yield. These all pay 2%+ with scores above 56.
For total return: LECO, WMT, and GWW offer lower yields but much stronger growth and market outperformance. Their dividends are growing fast enough that you’ll earn more in 10 years than today’s high-yield picks.
For maximum safety: Filter by crisis survival. JNJ, GWW, ITW, MMM, PPG, and EMR have survived every crisis we track while maintaining their dividend streaks. If the next recession hits tomorrow, these are the Aristocrats most likely to keep raising their dividends.
For portfolio construction: Consider the Classic age-based strategy, which automatically picks the highest-scoring stocks across all sectors and adjusts your stock/bond mix as you age. Many of the Aristocrats on this list would be natural candidates for the stock portion of that portfolio.
The Bottom Line
Dividend Aristocrats earned their title by doing one thing consistently for 25+ years: raising dividends. But our AI analysis shows the gap between the best and worst Aristocrats is enormous — from LECO’s 73.0 to SJM’s 32.0.
The top 10 share common traits: strong valuations relative to their sectors, proven crisis resilience, and business models that generate more cash than they need. They don’t necessarily have the highest yields — in fact, 7 of our top 10 yield under 2.2%. But they have something more valuable: the ability to keep growing those dividends for the next 25 years.
The worst Aristocrats, meanwhile, often sport high yields that mask deteriorating fundamentals or sit in sectors with structural headwinds. A high yield alone doesn’t make a stock worth owning — what matters is whether the business can sustain and grow that dividend.
Choose your Aristocrats wisely. The streak matters, but what’s behind it matters more.
Scores based on EasyStocksAI’s 4-pillar scoring system as of March 2026. Past performance does not guarantee future results. This is not financial advice — always do your own research before investing.