Introduction: The $10 Trillion Lesson
In 2008, the S&P 500 lost 37% of its value. Millions of investors saw their portfolios cut in half. Retirement dreams were shattered. Yet a small group of stocks not only survived—they thrived.
Johnson & Johnson JNJ fell just 8%. Procter & Gamble PG dropped 15%. These weren’t exciting tech stocks. They were boring, dividend-paying companies that had survived recessions before.
This is the power of crisis resilience—and it’s the most overlooked factor in stock analysis today.
At EasyStocksAI, we track crisis resilience for 891+ stocks. It’s one of 10 factors in our AI scoring system. And it might be the most important one.
What Is Crisis Resilience?
Crisis resilience measures how a stock performs during major market downturns.
Not just any dips. We’re talking about:
- The Dot-com Crash (2000-2002): -49% S&P 500
- The Financial Crisis (2008-2009): -57% S&P 500
- The COVID Crash (March 2020): -34% S&P 500
- The 2022 Bear Market: -25% S&P 500
A crisis-resilient stock doesn’t just recover—it holds its ground while others crumble.
How We Calculate Crisis Resilience
Our AI analyzes performance across 10+ historical crises:
- Drawdown Severity: How far did it fall vs. the S&P 500?
- Recovery Speed: How quickly did it bounce back?
- Dividend Continuity: Did it maintain or cut payouts?
- Relative Performance: Did it outperform the market during the crisis?
Each stock gets a score from 0-15. The higher the score, the more resilient.
Why Crisis Resilience Matters More Than Ever
The Math Is Brutal
A 50% loss requires a 100% gain just to break even.
| Loss | Gain Needed to Recover |
|---|---|
| -10% | +11% |
| -20% | +25% |
| -30% | +43% |
| -40% | +67% |
| -50% | +100% |
| -60% | +150% |
Crisis-resilient stocks don’t fall as far. This means they recover faster and compound wealth better over time.
Dividend Investors Need It Most
If you rely on dividend income, crisis resilience isn’t optional—it’s essential.
During the 2008 crisis:
- 40% of dividend-paying stocks cut or eliminated payouts
- The average dividend cut was 23%
- Crisis-resilient stocks maintained 94% of their dividends
When you’re living off dividend income, a 23% cut means eating into principal or reducing your lifestyle.
The Psychological Factor
Here’s what financial models miss: human behavior.
When your portfolio drops 50%, you’ll probably panic sell. Everyone thinks they won’t. The data says otherwise.
Crisis-resilient portfolios have smaller drawdowns. This means:
- Less panic
- Fewer bad decisions
- Better long-term returns
It’s not just about the math. It’s about sleeping well at night.
Real Examples: Crisis Resilience in Action
Example 1: Coca-Cola KO
Crisis Resilience Score: 14/15
| Crisis | S&P 500 | Coca-Cola | Dividend |
|---|---|---|---|
| 2000-2002 | -49% | -27% | ✅ Maintained |
| 2008-2009 | -57% | -31% | ✅ Maintained |
| 2020 | -34% | -20% | ✅ Maintained |
| 2022 | -25% | -5% | ✅ Maintained |
Interactive Chart:
Key Stats:
- 62 consecutive years of dividend increases
- Average crisis drawdown: -21% (vs -41% for S&P 500)
- Current yield: 3.2%
Why it works: Recession or not, people still drink Coke. The business is simple, global, and essential.
Example 2: Microsoft MSFT
Crisis Resilience Score: 12/15
| Crisis | S&P 500 | Microsoft | Dividend |
|---|---|---|---|
| 2000-2002 | -49% | -65%* | ✅ Started dividend 2003 |
| 2008-2009 | -57% | -55% | ✅ Maintained |
| 2020 | -34% | +14% | ✅ Maintained |
| 2022 | -25% | -28% | ✅ Maintained |
*Note: Microsoft learned from the dot-com crash. It transformed into a dividend-paying, cloud-focused company.
Interactive Chart:
Key Stats:
- 20 consecutive years of dividend increases
- 2020: Actually gained value during COVID crash
- Current yield: 0.7% (low but growing 10%+ annually)
Why it works: Recurring revenue from Office 365 and Azure. Businesses can’t operate without Microsoft.
Example 3: Boeing BA - The Counterexample
Crisis Resilience Score: 4/15
| Crisis | S&P 500 | Boeing | Dividend |
|---|---|---|---|
| 2008-2009 | -57% | -72% | ✅ Maintained |
| 2020 | -34% | -52% | ❌ Suspended |
| 2022 | -25% | -8% | ❌ Still suspended |
Interactive Chart:
What went wrong:
- 737 MAX crisis (2019)
- COVID destroyed air travel demand
- High debt, cyclical business
- Dividend suspended for 4+ years
The lesson: Not all blue chips are crisis-resilient. You need to look deeper than brand recognition.
Compare Side-by-Side
Crisis Performance Comparison:
See how JNJ, PG, and KO performed vs SPY during the last decade including the 2020 crash.
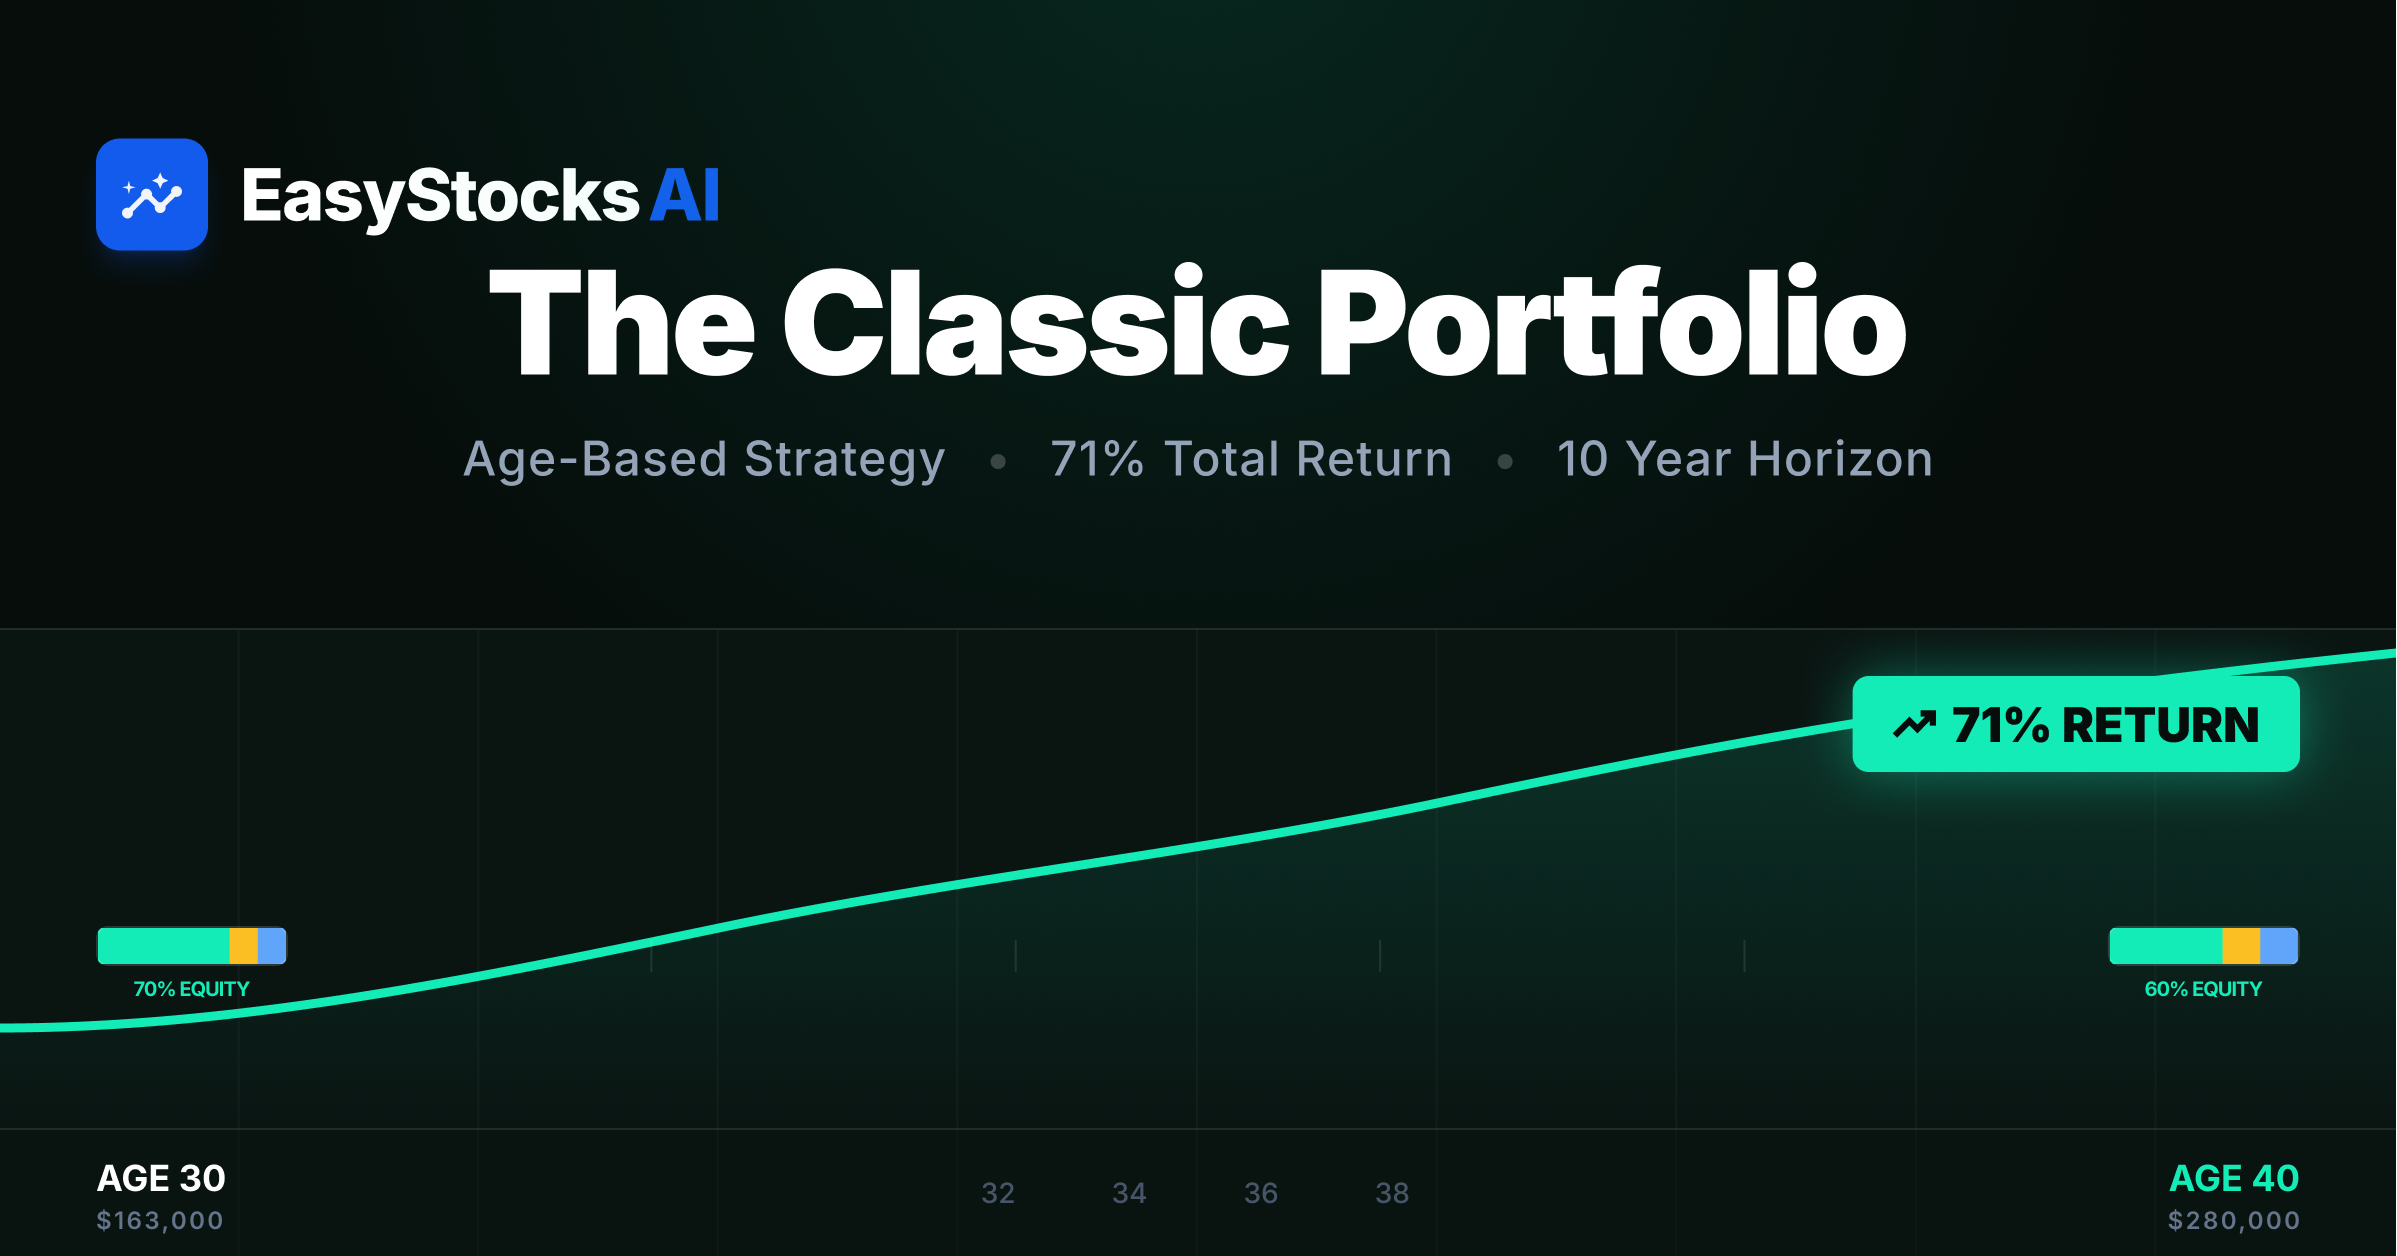
How to Use Crisis Resilience in Your Portfolio
For Dividend Investors
Target: Stocks with crisis resilience scores of 10+
Why: These stocks maintained dividends through multiple crises. They’re your income insurance policy.
Top sectors for crisis resilience:
- Consumer Staples (Coke, Pepsi, Procter & Gamble)
- Healthcare (Johnson & Johnson, AbbVie)
- Utilities (NextEra Energy, Southern Company)
Avoid: Airlines, cruise lines, luxury retailers, highly cyclical industrials
For Growth Investors
Target: Stocks with resilience score of 8+ AND strong growth metrics
Why: You want growth, but not at the cost of total portfolio destruction in the next crash.
Sweet spot: Tech companies with recurring revenue (Microsoft, Adobe, Salesforce)
For Retirees
Target: Portfolio average crisis resilience score of 11+
Why: You can’t afford a 50% drawdown when you’re withdrawing 4% annually. The math doesn’t work.
Strategy: 70% high-resilience dividend stocks, 30% bonds/TIPS
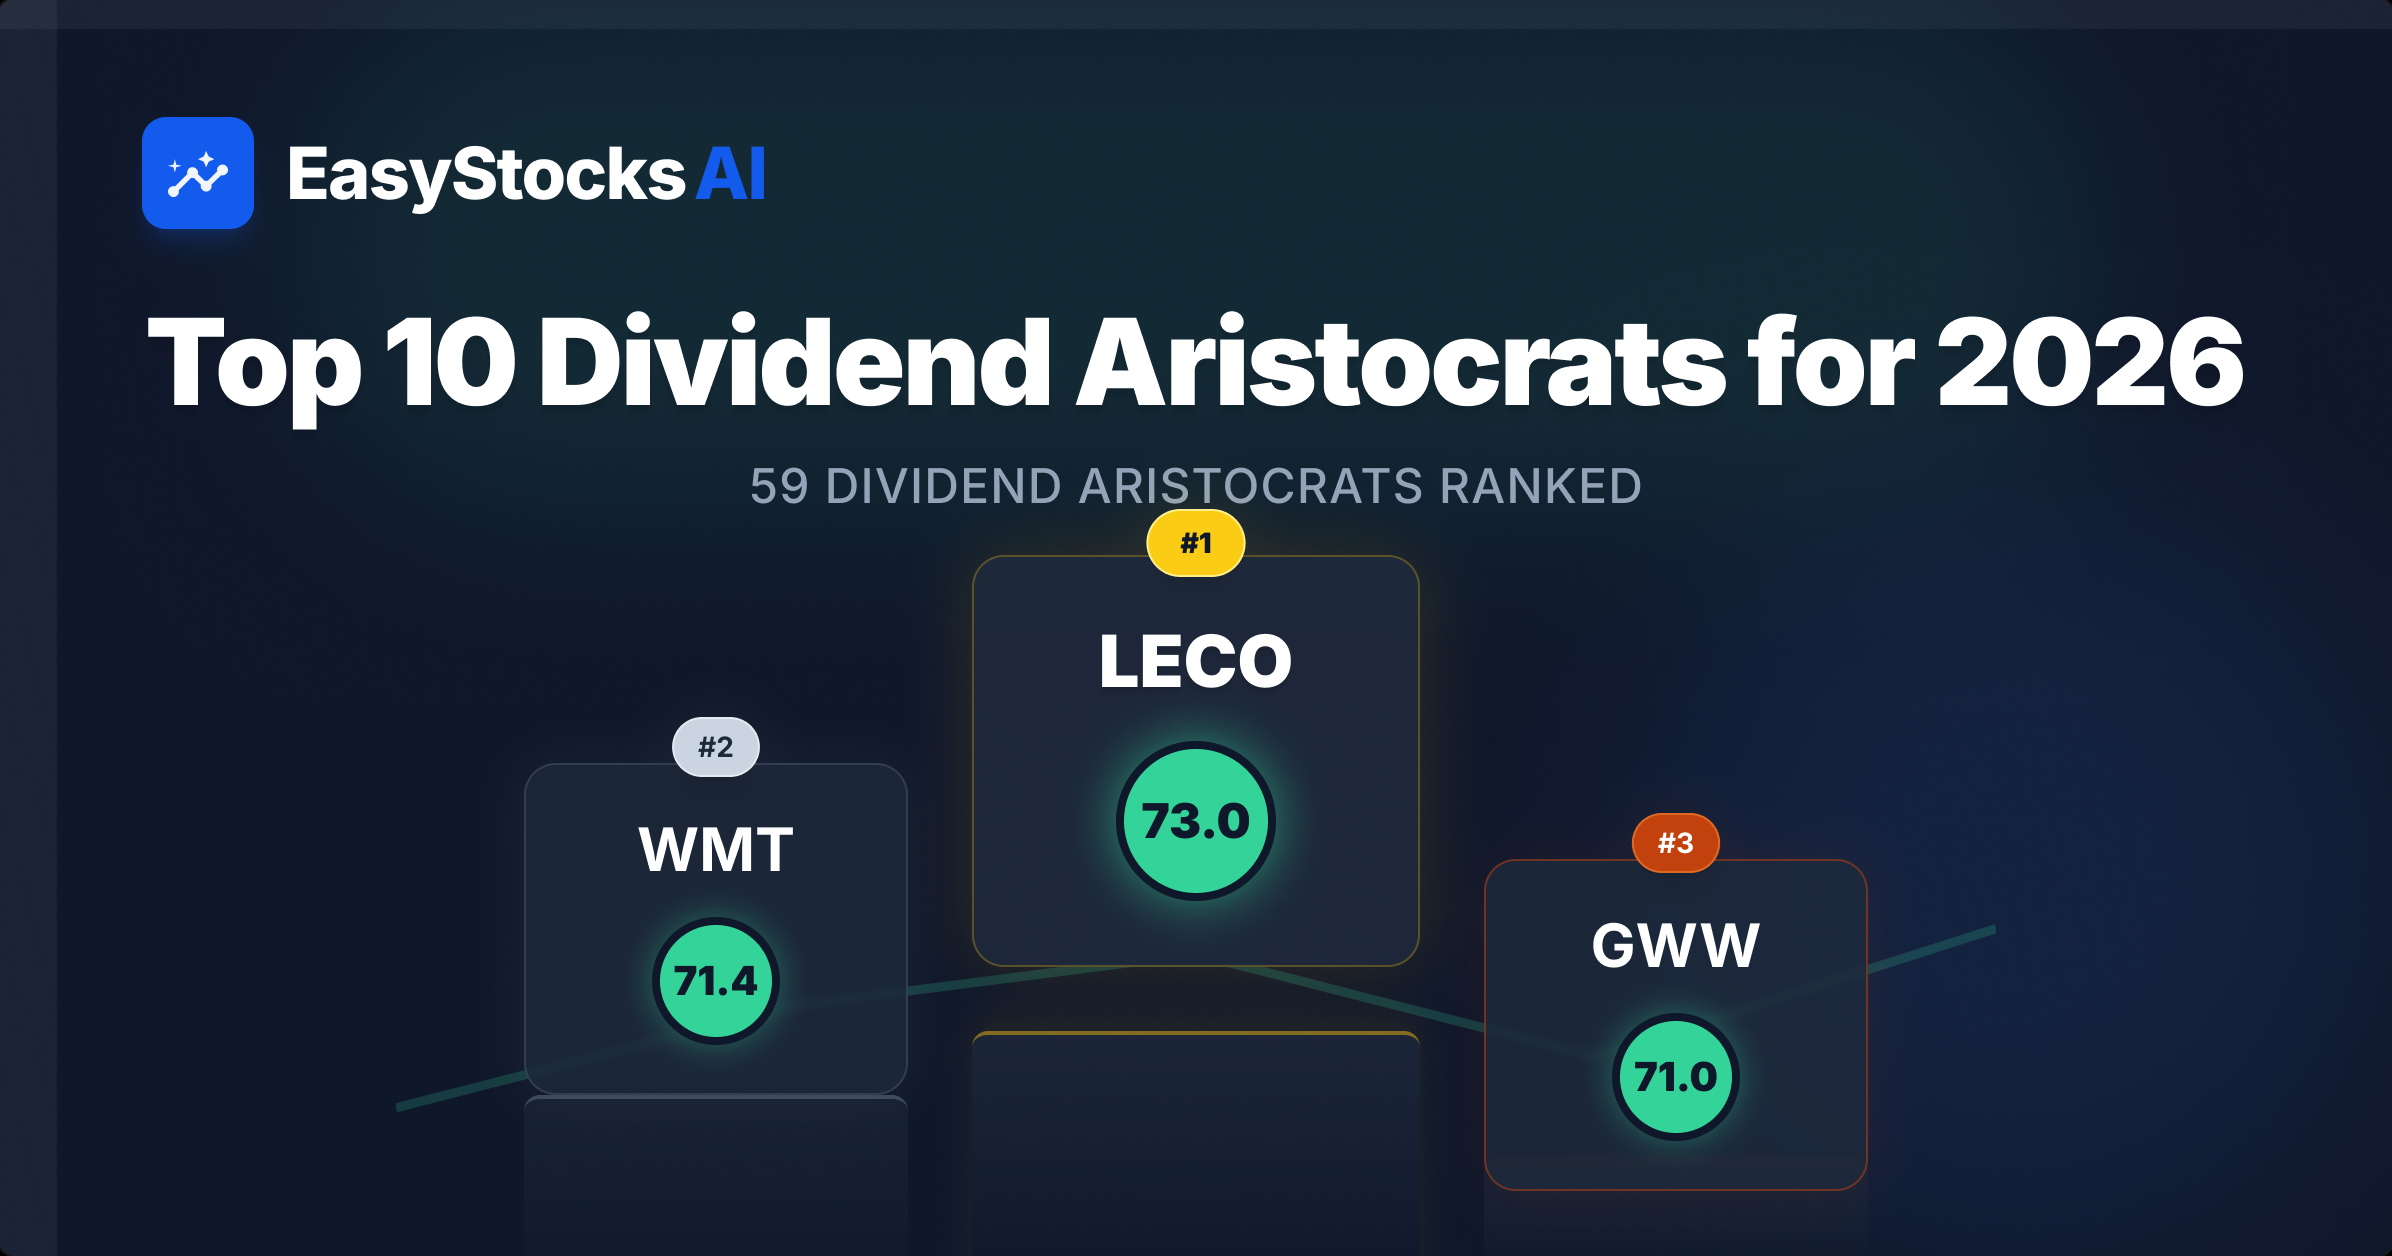
Top 10 Crisis-Resilient Stocks Right Now
Based on our AI analysis of 891+ stocks:
| Rank | Ticker | Company | Crisis Resilience | Yield |
|---|---|---|---|---|
| 1 | JNJ | Johnson & Johnson | 15/15 | 3.1% |
| 2 | PG | Procter & Gamble | 15/15 | 2.4% |
| 3 | KO | Coca-Cola | 14/15 | 3.2% |
| 4 | PEP | PepsiCo | 14/15 | 3.0% |
| 5 | WMT | Walmart | 13/15 | 1.4% |
| 6 | ABBV | AbbVie | 13/15 | 3.5% |
| 7 | TGT | Target | 12/15 | 3.1% |
| 8 | MSFT | Microsoft | 12/15 | 0.7% |
| 9 | COST | Costco | 12/15 | 0.6% |
| 10 | NEE | NextEra Energy | 11/15 | 3.3% |
Scores and yields as of February 2025. See EasyStocksAI.tech for current data.
Visual Comparison
Top 5 Crisis-Resilient Stocks vs S&P 500:
See how these Dividend Aristocrats performed through multiple market crashes compared to the broader market.
How to Use Crisis Resilience in Your Portfolio
For Dividend Investors
Target: Stocks with crisis resilience scores of 10+
Top Picks:
- JNJ - 15/15 crisis resilience, 62 years of dividend increases
- PG - 15/15 crisis resilience, consumer staples leader
- KO - 14/15 crisis resilience, global brand moat
Why: These stocks maintained dividends through [[2008]], [[2020]], and [[2022]] crashes. They are your income insurance policy.
Interactive Tool
Compare Any Stocks: Use our interactive charts to compare any stock against SPY or sector ETFs.
Example comparisons:
- JNJ vs Health Care Sector - MSFT vs Technology Sector- KO vs Consumer Staples Sector
The Bottom Line
Crisis resilience isn’t about predicting the next crash. It’s about being prepared for it.
Every investor knows they should “buy low, sell high.” But when the market drops 40%, emotions take over. Crisis-resilient portfolios don’t drop as far, which means:
- Less panic
- Better decision-making
- Faster recovery
- Better long-term returns
It’s not the most exciting investing strategy. But it’s the one that works.
Start tracking crisis resilience today. Your future self will thank you.
See Crisis Resilience Scores for 891+ Stocks
Every stock on EasyStocksAI includes:
- ✅ Crisis resilience score
- ✅ Performance during 2020, 2022 crashes
- ✅ Dividend continuity through crises
- ✅ Interactive charts
- ✅ 9 other AI-scored factors
Disclaimer: This content is for educational purposes only. It does not constitute personalized financial advice. All investment decisions are your own responsibility. Past performance does not guarantee future results.